hus14
hus14
hus14
You also want an ePaper? Increase the reach of your titles
YUMPU automatically turns print PDFs into web optimized ePapers that Google loves.
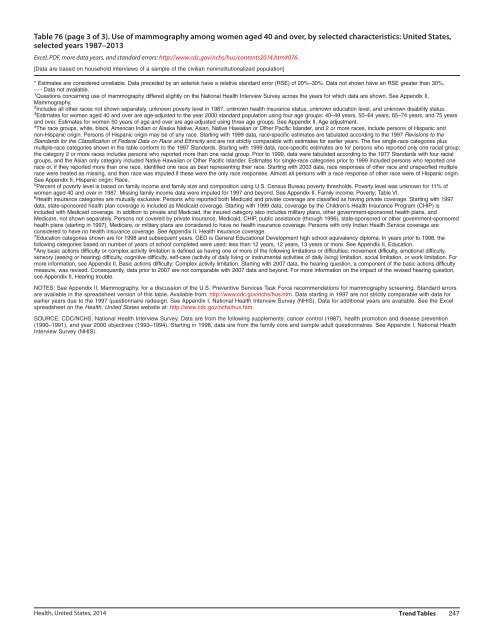
Table 76 (page 3 of 3). Use of mammography among women aged 40 and over, by selected characteristics: United States,<br />
selected years 1987–2013<br />
Excel, PDF, more data years, and standard errors: http://www.cdc.gov/nchs/hus/contents2014.htm#076.<br />
[Data are based on household interviews of a sample of the civilian noninstitutionalized population]<br />
* Estimates are considered unreliable. Data preceded by an asterisk have a relative standard error (RSE) of 20%–30%. Data not shown have an RSE greater than 30%.<br />
---Data not available.<br />
1 Questions concerning use of mammography differed slightly on the National Health Interview Survey across the years for which data are shown. See Appendix II,<br />
Mammography.<br />
2 Includes all other races not shown separately, unknown poverty level in 1987, unknown health insurance status, unknown education level, and unknown disability status.<br />
3 Estimates for women aged 40 and over are age-adjusted to the year 2000 standard population using four age groups: 40–49 years, 50–64 years, 65–74 years, and 75 years<br />
and over. Estimates for women 50 years of age and over are age-adjusted using three age groups. See Appendix II, Age adjustment.<br />
4 The race groups, white, black, American Indian or Alaska Native, Asian, Native Hawaiian or Other Pacific Islander, and 2 or more races, include persons of Hispanic and<br />
non-Hispanic origin. Persons of Hispanic origin may be of any race. Starting with 1999 data, race-specific estimates are tabulated according to the 1997 Revisions to the<br />
Standards for the Classification of Federal Data on Race and Ethnicity and are not strictly comparable with estimates for earlier years. The five single-race categories plus<br />
multiple-race categories shown in the table conform to the 1997 Standards. Starting with 1999 data, race-specific estimates are for persons who reported only one racial group;<br />
the category 2 or more races includes persons who reported more than one racial group. Prior to 1999, data were tabulated according to the 1977 Standards with four racial<br />
groups, and the Asian only category included Native Hawaiian or Other Pacific Islander. Estimates for single-race categories prior to 1999 included persons who reported one<br />
race or, if they reported more than one race, identified one race as best representing their race. Starting with 2003 data, race responses of other race and unspecified multiple<br />
race were treated as missing, and then race was imputed if these were the only race responses. Almost all persons with a race response of other race were of Hispanic origin.<br />
See Appendix II, Hispanic origin; Race.<br />
5 Percent of poverty level is based on family income and family size and composition using U.S. Census Bureau poverty thresholds. Poverty level was unknown for 11% of<br />
women aged 40 and over in 1987. Missing family income data were imputed for 1997 and beyond. See Appendix II, Family income; Poverty; Table VI.<br />
6 Health insurance categories are mutually exclusive. Persons who reported both Medicaid and private coverage are classified as having private coverage. Starting with 1997<br />
data, state-sponsored health plan coverage is included as Medicaid coverage. Starting with 1999 data, coverage by the Children’s Health Insurance Program (CHIP) is<br />
included with Medicaid coverage. In addition to private and Medicaid, the insured category also includes military plans, other government-sponsored health plans, and<br />
Medicare, not shown separately. Persons not covered by private insurance, Medicaid, CHIP, public assistance (through 1996), state-sponsored or other government-sponsored<br />
health plans (starting in 1997), Medicare, or military plans are considered to have no health insurance coverage. Persons with only Indian Health Service coverage are<br />
considered to have no health insurance coverage. See Appendix II, Health insurance coverage.<br />
7 Education categories shown are for 1998 and subsequent years. GED is General Educational Development high school equivalency diploma. In years prior to 1998, the<br />
following categories based on number of years of school completed were used: less than 12 years, 12 years, 13 years or more. See Appendix II, Education.<br />
8 Any basic actions difficulty or complex activity limitation is defined as having one or more of the following limitations or difficulties: movement difficulty, emotional difficulty,<br />
sensory (seeing or hearing) difficulty, cognitive difficulty, self-care (activity of daily living or instrumental activities of daily living) limitation, social limitation, or work limitation. For<br />
more information, see Appendix II, Basic actions difficulty; Complex activity limitation. Starting with 2007 data, the hearing question, a component of the basic actions difficulty<br />
measure, was revised. Consequently, data prior to 2007 are not comparable with 2007 data and beyond. For more information on the impact of the revised hearing question,<br />
see Appendix II, Hearing trouble.<br />
NOTES: See Appendix II, Mammography, for a discussion of the U.S. Preventive Services Task Force recommendations for mammography screening. Standard errors<br />
are available in the spreadsheet version of this table. Available from: http://www.cdc.gov/nchs/hus.htm. Data starting in 1997 are not strictly comparable with data for<br />
earlier years due to the 1997 questionnaire redesign. See Appendix I, National Health Interview Survey (NHIS). Data for additional years are available. See the Excel<br />
spreadsheet on the Health, United States website at: http://www.cdc.gov/nchs/hus.htm.<br />
SOURCE: CDC/NCHS, National Health Interview Survey. Data are from the following supplements: cancer control (1987), health promotion and disease prevention<br />
(1990–1991), and year 2000 objectives (1993–1994). Starting in 1998, data are from the family core and sample adult questionnaires. See Appendix I, National Health<br />
Interview Survey (NHIS).<br />
Health, United States, 2014 Trend Tables 247


