

hus14
hus14
hus14

You also want an ePaper? Increase the reach of your titles
YUMPU automatically turns print PDFs into web optimized ePapers that Google loves.
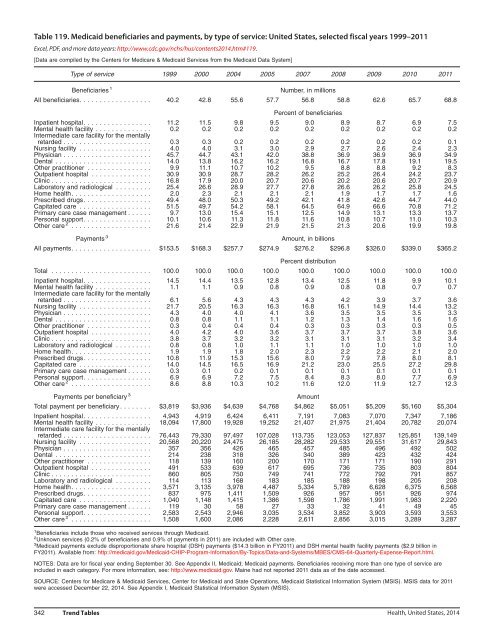
Table 119. Medicaid beneficiaries and payments, by type of service: United States, selected fiscal years 1999–2011<br />
Excel, PDF, and more data years: http://www.cdc.gov/nchs/hus/contents2014.htm#119.<br />
[Data are compiled by the Centers for Medicare & Medicaid Services from the Medicaid Data System]<br />
Type of service 1999 2000 2004 2005 2007 2008 2009 2010 2011<br />
Beneficiaries 1<br />
Number, in millions<br />
All beneficiaries. ................. 40.2 42.8 55.6 57.7 56.8 58.8 62.6 65.7 68.8<br />
Percent of beneficiaries<br />
Inpatient hospital. ................ 11.2 11.5 9.8 9.5 9.0 8.9 8.7 6.9 7.5<br />
Mental health facility .............. 0.2 0.2 0.2 0.2 0.2 0.2 0.2 0.2 0.2<br />
Intermediate care facility for the mentally<br />
retarded ...................... 0.3 0.3 0.2 0.2 0.2 0.2 0.2 0.2 0.1<br />
Nursing facility .................. 4.0 4.0 3.1 3.0 2.9 2.7 2.6 2.4 2.3<br />
Physician ...................... 45.7 44.7 43.1 42.0 38.8 36.9 36.9 36.9 34.9<br />
Dental ........................ 14.0 13.8 16.2 16.2 16.8 16.7 17.8 19.1 19.5<br />
Other practitioner ................ 9.9 11.1 10.7 10.2 9.5 8.8 8.8 9.2 8.3<br />
Outpatient hospital ............... 30.9 30.9 28.7 28.2 26.2 25.2 26.4 24.2 23.7<br />
Clinic ......................... 16.8 17.9 20.0 20.7 20.6 20.2 20.6 20.7 20.9<br />
Laboratory and radiological ......... 25.4 26.6 28.9 27.7 27.8 26.6 26.2 25.8 24.5<br />
Home health .................... 2.0 2.3 2.1 2.1 2.1 1.9 1.7 1.7 1.6<br />
Prescribed drugs. ................ 49.4 48.0 50.3 49.2 42.1 41.8 42.6 44.7 44.0<br />
Capitated care .................. 51.5 49.7 54.2 58.1 64.5 64.9 66.6 70.8 71.2<br />
Primary care case management ...... 9.7 13.0 15.4 15.1 12.5 14.9 13.1 13.3 13.7<br />
Personal support. ................<br />
Other care 2 ....................<br />
10.1<br />
21.6<br />
10.6<br />
21.4<br />
11.3<br />
22.9<br />
Payments 3<br />
Amount, in billions<br />
All payments. ................... $153.5 $168.3 $257.7 $274.9 $276.2 $296.8 $326.0 $339.0 $365.2<br />
Percent distribution<br />
Total ......................... 100.0 100.0 100.0 100.0 100.0 100.0 100.0 100.0 100.0<br />
Inpatient hospital. ................ 14.5 14.4 13.5 12.8 13.4 12.5 11.8 9.9 10.1<br />
Mental health facility .............. 1.1 1.1 0.9 0.8 0.9 0.8 0.8 0.7 0.7<br />
Intermediate care facility for the mentally<br />
retarded ...................... 6.1 5.6 4.3 4.3 4.3 4.2 3.9 3.7 3.6<br />
Nursing facility .................. 21.7 20.5 16.3 16.3 16.8 16.1 14.9 14.4 13.2<br />
Physician ...................... 4.3 4.0 4.0 4.1 3.6 3.5 3.5 3.5 3.3<br />
Dental ........................ 0.8 0.8 1.1 1.1 1.2 1.3 1.4 1.6 1.6<br />
Other practitioner ................ 0.3 0.4 0.4 0.4 0.3 0.3 0.3 0.3 0.5<br />
Outpatient hospital ............... 4.0 4.2 4.0 3.6 3.7 3.7 3.7 3.8 3.6<br />
Clinic ......................... 3.8 3.7 3.2 3.2 3.1 3.1 3.1 3.2 3.4<br />
Laboratory and radiological ......... 0.8 0.8 1.0 1.1 1.1 1.0 1.0 1.0 1.0<br />
Home health .................... 1.9 1.9 1.8 2.0 2.3 2.2 2.2 2.1 2.0<br />
Prescribed drugs. ................ 10.8 11.9 15.3 15.6 8.0 7.9 7.8 8.0 8.1<br />
Capitated care .................. 14.0 14.5 16.5 16.9 21.2 23.0 25.5 27.2 29.8<br />
Primary care case management ...... 0.3 0.1 0.2 0.1 0.1 0.1 0.1 0.1 0.1<br />
Personal support. ................<br />
Other care 2 ....................<br />
6.9<br />
8.6<br />
6.9<br />
8.8<br />
7.2<br />
10.3<br />
7.5<br />
10.2<br />
8.4<br />
11.6<br />
8.3<br />
12.0<br />
8.0<br />
11.9<br />
7.7<br />
12.7<br />
6.9<br />
12.3<br />
Payments per beneficiary 3<br />
Amount<br />
Total payment per beneficiary ........ $3,819 $3,936 $4,639 $4,768 $4,862 $5,051 $5,209 $5,160 $5,304<br />
Inpatient hospital. ................ 4,943 4,919 6,424 6,411 7,191 7,083 7,070 7,347 7,186<br />
Mental health facility .............. 18,094 17,800 19,928 19,252 21,407 21,975 21,404 20,782 20,074<br />
Intermediate care facility for the mentally<br />
retarded ...................... 76,443 79,330 97,497 107,028 113,735 123,053 127,837 125,851 139,149<br />
Nursing facility .................. 20,568 20,220 24,475 26,185 28,282 29,533 29,551 31,617 29,843<br />
Physician ...................... 357 356 426 465 457 485 496 492 502<br />
Dental ........................ 214 238 318 326 340 389 423 432 424<br />
Other practitioner ................ 118 139 160 200 170 171 171 190 291<br />
Outpatient hospital ............... 491 533 639 617 695 736 735 803 804<br />
Clinic ......................... 860 805 750 749 741 772 792 791 857<br />
Laboratory and radiological ......... 114 113 168 183 185 188 198 205 208<br />
Home health .................... 3,571 3,135 3,978 4,487 5,334 5,789 6,628 6,375 6,568<br />
Prescribed drugs. ................ 837 975 1,411 1,509 926 957 951 926 974<br />
Capitated care .................. 1,040 1,148 1,415 1,386 1,598 1,786 1,991 1,983 2,220<br />
Primary care case management ...... 119 30 58 27 33 32 41 49 45<br />
Personal support. ................<br />
Other care 2 ....................<br />
2,583<br />
1,508<br />
2,543<br />
1,600<br />
2,946<br />
2,086<br />
3,035<br />
2,228<br />
3,534<br />
2,611<br />
3,852<br />
2,856<br />
3,903<br />
3,015<br />
3,593<br />
3,289<br />
3,553<br />
3,287<br />
1 Beneficiaries include those who received services through Medicaid.<br />
2 Unknown services (0.2% of beneficiaries and 0.9% of payments in 2011) are included with Other care.<br />
3 Medicaid payments exclude disproportionate share hospital (DSH) payments ($14.3 billion in FY2011) and DSH mental health facility payments ($2.9 billion in<br />
FY2011). Available from: http://medicaid.gov/Medicaid-CHIP-Program-Information/By-Topics/Data-and-Systems/MBES/CMS-64-Quarterly-Expense-Report.html.<br />
NOTES: Data are for fiscal year ending September 30. See Appendix II, Medicaid; Medicaid payments. Beneficiaries receiving more than one type of service are<br />
included in each category. For more information, see: http://www.medicaid.gov. Maine had not reported 2011 data as of the date accessed.<br />
SOURCE: Centers for Medicare & Medicaid Services, Center for Medicaid and State Operations, Medicaid Statistical Information System (MSIS). MSIS data for 2011<br />
were accessed December 22, 2014. See Appendix I, Medicaid Statistical Information System (MSIS).<br />
11.8<br />
21.9<br />
11.6<br />
21.5<br />
10.8<br />
21.3<br />
10.7<br />
20.6<br />
11.0<br />
19.9<br />
10.3<br />
19.8<br />
342 Trend Tables Health, United States, 2014