

hus14
hus14
hus14

You also want an ePaper? Increase the reach of your titles
YUMPU automatically turns print PDFs into web optimized ePapers that Google loves.
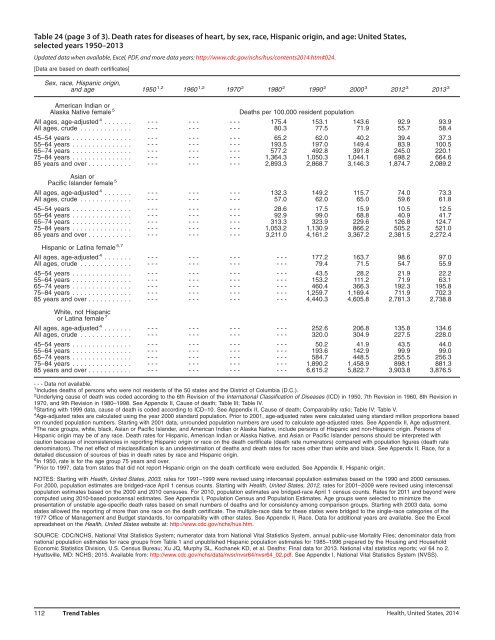
Table 24 (page 3 of 3). Death rates for diseases of heart, by sex, race, Hispanic origin, and age: United States,<br />
selected years 1950–2013<br />
Updated data when available, Excel, PDF, and more data years: http://www.cdc.gov/nchs/hus/contents2014.htm#024.<br />
[Data are based on death certificates]<br />
Sex, race, Hispanic origin,<br />
and age 1950 1,2 1960 1,2 1970 2 1980 2 1990 2 2000 3 2012 3 2013 3<br />
American Indian or<br />
Alaska Native female 5<br />
Deaths per 100,000 resident population<br />
All ages, age-adjusted 4 ....... -- -- -- 175.4 153.1 143.6 92.9 93.9<br />
All ages, crude ............. -- -- -- 80.3 77.5 71.9 55.7 58.4<br />
45–54 years ............... -- -- -- 65.2 62.0 40.2 39.4 37.3<br />
55–64 years ............... -- -- -- 193.5 197.0 149.4 83.9 100.5<br />
65–74 years ............... -- -- -- 577.2 492.8 391.8 245.0 220.1<br />
75–84 years ............... -- -- -- 1,364.3 1,050.3 1,044.1 698.2 664.6<br />
85 years and over ........... -- -- -- 2,893.3 2,868.7 3,146.3 1,874.7 2,089.2<br />
Asian or<br />
Pacific Islander female 5<br />
All ages, age-adjusted 4 ....... -- -- -- 132.3 149.2 115.7 74.0 73.3<br />
All ages, crude ............. -- -- -- 57.0 62.0 65.0 59.6 61.8<br />
45–54 years ............... -- -- -- 28.6 17.5 15.9 10.5 12.5<br />
55–64 years ............... -- -- -- 92.9 99.0 68.8 40.9 41.7<br />
65–74 years ............... -- -- -- 313.3 323.9 229.6 126.8 124.7<br />
75–84 years ............... -- -- -- 1,053.2 1,130.9 866.2 505.2 521.0<br />
85 years and over ........... -- -- -- 3,211.0 4,161.2 3,367.2 2,381.5 2,272.4<br />
Hispanic or Latina female 5,7<br />
All ages, age-adjusted 4 ....... -- -- -- -- 177.2 163.7 98.6 97.0<br />
All ages, crude ............. -- -- -- -- 79.4 71.5 54.7 55.9<br />
45–54 years ............... -- -- -- -- 43.5 28.2 21.9 22.2<br />
55–64 years ............... -- -- -- -- 153.2 111.2 71.9 63.1<br />
65–74 years ............... -- -- -- -- 460.4 366.3 192.3 195.8<br />
75–84 years ............... -- -- -- -- 1,259.7 1,169.4 711.9 702.3<br />
85 years and over ........... -- -- -- -- 4,440.3 4,605.8 2,781.3 2,738.8<br />
White, not Hispanic<br />
or Latina female 7<br />
All ages, age-adjusted 4 ....... -- -- -- -- 252.6 206.8 135.8 134.6<br />
All ages, crude ............. -- -- -- -- 320.0 304.9 227.5 228.0<br />
45–54 years ............... -- -- -- -- 50.2 41.9 43.5 44.0<br />
55–64 years ............... -- -- -- -- 193.6 142.9 99.9 99.0<br />
65–74 years ............... -- -- -- -- 584.7 448.5 255.5 256.3<br />
75–84 years ............... -- -- -- -- 1,890.2 1,458.9 898.1 881.3<br />
85 years and over ........... -- -- -- -- 6,615.2 5,822.7 3,903.8 3,876.5<br />
---Data not available.<br />
1 Includes deaths of persons who were not residents of the 50 states and the District of Columbia (D.C.).<br />
2 Underlying cause of death was coded according to the 6th Revision of the International Classification of Diseases (ICD) in 1950, 7th Revision in 1960, 8th Revision in<br />
1970, and 9th Revision in 1980–1998. See Appendix II, Cause of death; Table III; Table IV.<br />
3 Starting with 1999 data, cause of death is coded according to ICD–10. See Appendix II, Cause of death; Comparability ratio; Table IV; Table V.<br />
4 Age-adjusted rates are calculated using the year 2000 standard population. Prior to 2001, age-adjusted rates were calculated using standard million proportions based<br />
on rounded population numbers. Starting with 2001 data, unrounded population numbers are used to calculate age-adjusted rates. See Appendix II, Age adjustment.<br />
5 The race groups, white, black, Asian or Pacific Islander, and American Indian or Alaska Native, include persons of Hispanic and non-Hispanic origin. Persons of<br />
Hispanic origin may be of any race. Death rates for Hispanic, American Indian or Alaska Native, and Asian or Pacific Islander persons should be interpreted with<br />
caution because of inconsistencies in reporting Hispanic origin or race on the death certificate (death rate numerators) compared with population figures (death rate<br />
denominators). The net effect of misclassification is an underestimation of deaths and death rates for races other than white and black. See Appendix II, Race, for a<br />
detailed discussion of sources of bias in death rates by race and Hispanic origin.<br />
6 In 1950, rate is for the age group 75 years and over.<br />
7 Prior to 1997, data from states that did not report Hispanic origin on the death certificate were excluded. See Appendix II, Hispanic origin.<br />
NOTES: Starting with Health, United States, 2003, rates for 1991–1999 were revised using intercensal population estimates based on the 1990 and 2000 censuses.<br />
For 2000, population estimates are bridged-race April 1 census counts. Starting with Health, United States, 2012, rates for 2001–2009 were revised using intercensal<br />
population estimates based on the 2000 and 2010 censuses. For 2010, population estimates are bridged-race April 1 census counts. Rates for 2011 and beyond were<br />
computed using 2010-based postcensal estimates. See Appendix I, Population Census and Population Estimates. Age groups were selected to minimize the<br />
presentation of unstable age-specific death rates based on small numbers of deaths and for consistency among comparison groups. Starting with 2003 data, some<br />
states allowed the reporting of more than one race on the death certificate. The multiple-race data for these states were bridged to the single-race categories of the<br />
1977 Office of Management and Budget standards, for comparability with other states. See Appendix II, Race. Data for additional years are available. See the Excel<br />
spreadsheet on the Health, United States website at: http://www.cdc.gov/nchs/hus.htm.<br />
SOURCE: CDC/NCHS, National Vital Statistics System; numerator data from National Vital Statistics System, annual public-use Mortality Files; denominator data from<br />
national population estimates for race groups from Table 1 and unpublished Hispanic population estimates for 1985–1996 prepared by the Housing and Household<br />
Economic Statistics Division, U.S. Census Bureau; Xu JQ, Murphy SL, Kochanek KD, et al. Deaths: Final data for 2013. National vital statistics reports; vol 64 no 2.<br />
Hyattsville, MD: NCHS; 2015. Available from: http://www.cdc.gov/nchs/data/nvsr/nvsr64/nvsr64_02.pdf. See Appendix I, National Vital Statistics System (NVSS).<br />
112 Trend Tables<br />
Health, United States, 2014