

hus14
hus14
hus14

You also want an ePaper? Increase the reach of your titles
YUMPU automatically turns print PDFs into web optimized ePapers that Google loves.
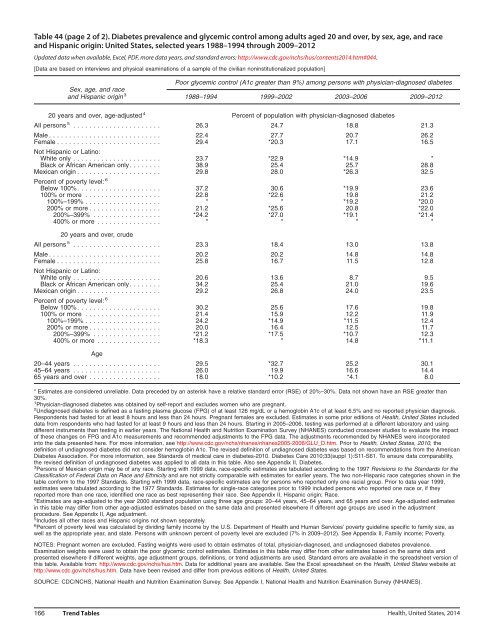
Table 44 (page 2 of 2). Diabetes prevalence and glycemic control among adults aged 20 and over, by sex, age, and race<br />
and Hispanic origin: United States, selected years 1988–1994 through 2009–2012<br />
Updated data when available, Excel, PDF, more data years, and standard errors: http://www.cdc.gov/nchs/hus/contents2014.htm#044.<br />
[Data are based on interviews and physical examinations of a sample of the civilian noninstitutionalized population]<br />
Poor glycemic control (A1c greater than 9%) among persons with physician-diagnosed diabetes<br />
Sex, age, and race<br />
and Hispanic origin 3 1988–1994 1999–2002 2003–2006 2009–2012<br />
20 years and over, age-adjusted 4 Percent of population with physician-diagnosed diabetes<br />
All persons 5 ...................... 26.3 24.7 18.8 21.3 <br />
Male............................ 22.4 27.7 20.7 26.2 <br />
Female.......................... 29.4 *20.3 17.1 16.5 <br />
Not Hispanic or Latino:<br />
White only ...................... 23.7 *22.9 *14.9 *<br />
Black or African American only ........ 38.9 25.4 25.7 28.8<br />
Mexican origin ..................... 29.8 28.0 *26.3 32.5 <br />
Percent of poverty level: 6<br />
Below 100%. .................... 37.2 30.6 *19.9 23.6<br />
100% or more ................... 22.8 *22.6 19.8 21.2<br />
100%–199% ...................<br />
200% or more ..................<br />
200%–399% .................<br />
400% or more ................<br />
*<br />
21.2<br />
*24.2<br />
*<br />
*<br />
*25.6<br />
*27.0<br />
*<br />
*19.2<br />
20.8<br />
*19.1<br />
*<br />
*20.0 <br />
*22.0 <br />
*21.4 <br />
* <br />
20 years and over, crude<br />
All persons 5 ...................... 23.3 18.4 13.0 13.8 <br />
Male............................ 20.2 20.2 14.8 14.8 <br />
Female.......................... 25.8 16.7 11.5 12.8 <br />
Not Hispanic or Latino:<br />
White only ...................... 20.6 13.6 8.7 9.5<br />
Black or African American only ........ 34.2 25.4 21.0 19.6<br />
Mexican origin ..................... 29.2 26.8 24.0 23.5 <br />
Percent of poverty level: 6<br />
Below 100%. .................... 30.2 25.6 17.6 19.8<br />
100% or more ................... 21.4 15.9 12.2 11.9<br />
100%–199% ...................<br />
200% or more ..................<br />
200%–399% .................<br />
400% or more ................<br />
24.2<br />
20.0<br />
*21.2<br />
*18.3<br />
*14.9<br />
16.4<br />
*17.5<br />
*<br />
*11.5<br />
12.5<br />
*10.7<br />
14.8<br />
12.4 <br />
11.7 <br />
12.3 <br />
*11.1 <br />
Age<br />
20–44 years ...................... 29.5 *32.7 25.2 30.1 <br />
45–64 years ...................... 26.0 19.9 16.6 14.4 <br />
65 years and over .................. 18.0 *10.2 *4.1 8.0 <br />
* Estimates are considered unreliable. Data preceded by an asterisk have a relative standard error (RSE) of 20%–30%. Data not shown have an RSE greater than<br />
30%.<br />
1 Physician-diagnosed diabetes was obtained by self-report and excludes women who are pregnant.<br />
2 Undiagnosed diabetes is defined as a fasting plasma glucose (FPG) of at least 126 mg/dL or a hemoglobin A1c of at least 6.5% and no reported physician diagnosis.<br />
Respondents had fasted for at least 8 hours and less than 24 hours. Pregnant females are excluded. Estimates in some prior editions of Health, United States included<br />
data from respondents who had fasted for at least 9 hours and less than 24 hours. Starting in 2005–2006, testing was performed at a different laboratory and using<br />
different instruments than testing in earlier years. The National Health and Nutrition Examination Survey (NHANES) conducted crossover studies to evaluate the impact<br />
of these changes on FPG and A1c measurements and recommended adjustments to the FPG data. The adjustments recommended by NHANES were incorporated<br />
into the data presented here. For more information, see http://www.cdc.gov/nchs/nhanes/nhanes2005-2006/GLU_D.htm. Prior to Health, United States, 2010, the<br />
definition of undiagnosed diabetes did not consider hemoglobin A1c. The revised definition of undiagnosed diabetes was based on recommendations from the American<br />
Diabetes Association. For more information, see Standards of medical care in diabetes-2010. Diabetes Care 2010;33(suppl 1):S11-S61. To ensure data comparability,<br />
the revised definition of undiagnosed diabetes was applied to all data in this table. Also see Appendix II, Diabetes.<br />
3 Persons of Mexican origin may be of any race. Starting with 1999 data, race-specific estimates are tabulated according to the 1997 Revisions to the Standards for the<br />
Classification of Federal Data on Race and Ethnicity and are not strictly comparable with estimates for earlier years. The two non-Hispanic race categories shown in the<br />
table conform to the 1997 Standards. Starting with 1999 data, race-specific estimates are for persons who reported only one racial group. Prior to data year 1999,<br />
estimates were tabulated according to the 1977 Standards. Estimates for single-race categories prior to 1999 included persons who reported one race or, if they<br />
reported more than one race, identified one race as best representing their race. See Appendix II, Hispanic origin; Race.<br />
4 Estimates are age-adjusted to the year 2000 standard population using three age groups: 20–44 years, 45–64 years, and 65 years and over. Age-adjusted estimates<br />
in this table may differ from other age-adjusted estimates based on the same data and presented elsewhere if different age groups are used in the adjustment<br />
procedure. See Appendix II, Age adjustment.<br />
5 Includes all other races and Hispanic origins not shown separately.<br />
6 Percent of poverty level was calculated by dividing family income by the U.S. Department of Health and Human Services’ poverty guideline specific to family size, as<br />
well as the appropriate year, and state. Persons with unknown percent of poverty level are excluded (7% in 2009–2012). See Appendix II, Family income; Poverty.<br />
NOTES: Pregnant women are excluded. Fasting weights were used to obtain estimates of total, physician-diagnosed, and undiagnosed diabetes prevalence.<br />
Examination weights were used to obtain the poor glycemic control estimates. Estimates in this table may differ from other estimates based on the same data and<br />
presented elsewhere if different weights, age adjustment groups, definitions, or trend adjustments are used. Standard errors are available in the spreadsheet version of<br />
this table. Available from: http://www.cdc.gov/nchs/hus.htm. Data for additional years are available. See the Excel spreadsheet on the Health, United States website at:<br />
http://www.cdc.gov/nchs/hus.htm. Data have been revised and differ from previous editions of Health, United States.<br />
SOURCE: CDC/NCHS, National Health and Nutrition Examination Survey. See Appendix I, National Health and Nutrition Examination Survey (NHANES).<br />
166 Trend Tables Health, United States, 2014