

Cohesive Consistent Confident
4mZ0Bv
4mZ0Bv

You also want an ePaper? Increase the reach of your titles
YUMPU automatically turns print PDFs into web optimized ePapers that Google loves.
Henry Boot PLC<br />
Annual Report and Financial Statements for the year ended 31 December 2015<br />
www.henryboot.co.uk<br />
Stock Code: BHY<br />
Financial Statements<br />
Notes to the Financial Statements continued<br />
for the year ended 31 December 2015<br />
12. Property, plant and equipment continued<br />
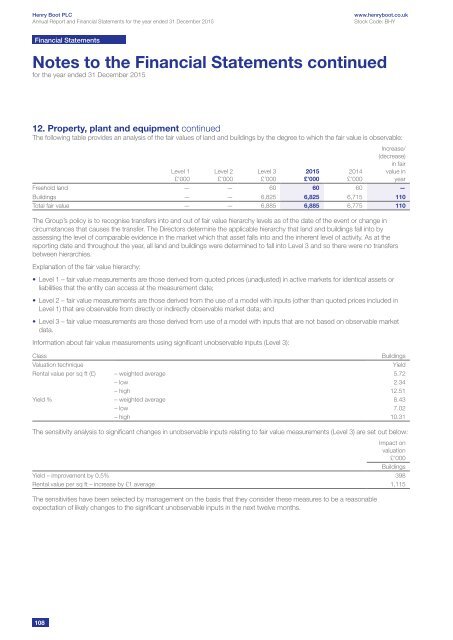
The following table provides an analysis of the fair values of land and buildings by the degree to which the fair value is observable:<br />
<br />
Level 1<br />
£’000<br />
Level 2<br />
£’000<br />
Level 3<br />
£’000<br />
2015<br />
£’000<br />
2014<br />
£’000<br />
Increase/<br />
(decrease)<br />
in fair<br />
value in<br />
year<br />
Freehold land — — 60 60 60 —<br />
Buildings — — 6,825 6,825 6,715 110<br />
Total fair value — — 6,885 6,885 6,775 110<br />
The Group’s policy is to recognise transfers into and out of fair value hierarchy levels as of the date of the event or change in<br />
circumstances that causes the transfer. The Directors determine the applicable hierarchy that land and buildings fall into by<br />
assessing the level of comparable evidence in the market which that asset falls into and the inherent level of activity. As at the<br />
reporting date and throughout the year, all land and buildings were determined to fall into Level 3 and so there were no transfers<br />
between hierarchies.<br />
Explanation of the fair value hierarchy:<br />
• Level 1 – fair value measurements are those derived from quoted prices (unadjusted) in active markets for identical assets or<br />
liabilities that the entity can access at the measurement date;<br />
• Level 2 – fair value measurements are those derived from the use of a model with inputs (other than quoted prices included in<br />
Level 1) that are observable from directly or indirectly observable market data; and<br />
• Level 3 – fair value measurements are those derived from use of a model with inputs that are not based on observable market<br />
data.<br />
Information about fair value measurements using significant unobservable inputs (Level 3):<br />
Class<br />
Buildings<br />
Valuation technique<br />
Yield<br />
Rental value per sq ft (£) – weighted average 5.72<br />
– low 2.34<br />
– high 12.51<br />
Yield % – weighted average 8.43<br />
– low 7.02<br />
– high 10.31<br />
The sensitivity analysis to significant changes in unobservable inputs relating to fair value measurements (Level 3) are set out below:<br />
Impact on<br />
valuation<br />
£’000<br />
Buildings<br />
Yield – improvement by 0.5% 398<br />
Rental value per sq ft – increase by £1 average 1,115<br />
The sensitivities have been selected by management on the basis that they consider these measures to be a reasonable<br />
expectation of likely changes to the significant unobservable inputs in the next twelve months.<br />
108