

Cohesive Consistent Confident
4mZ0Bv
4mZ0Bv

You also want an ePaper? Increase the reach of your titles
YUMPU automatically turns print PDFs into web optimized ePapers that Google loves.
Henry Boot PLC<br />
Annual Report and Financial Statements for the year ended 31 December 2015<br />
www.henryboot.co.uk<br />
Stock Code: BHY<br />
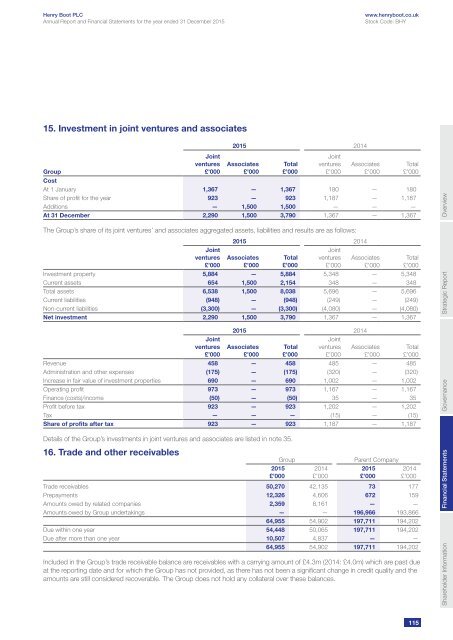
15. Investment in joint ventures and associates<br />
2015 2014<br />
Group<br />
Joint<br />
ventures<br />
£’000<br />
Associates<br />
£’000<br />
Total<br />
£’000<br />
Joint<br />
ventures<br />
£’000<br />
Associates<br />
£’000<br />
Cost<br />
At 1 January 1,367 — 1,367 180 — 180<br />
Share of profit for the year 923 — 923 1,187 — 1,187<br />
Additions — 1,500 1,500 — — —<br />
At 31 December 2,290 1,500 3,790 1,367 — 1,367<br />
The Group’s share of its joint ventures’ and associates aggregated assets, liabilities and results are as follows:<br />
2015 2014<br />
Joint<br />
ventures<br />
£’000<br />
Associates<br />
£’000<br />
Total<br />
£’000<br />
Joint<br />
ventures<br />
£’000<br />
Associates<br />
£’000<br />
Investment property 5,884 — 5,884 5,348 — 5,348<br />
Current assets 654 1,500 2,154 348 — 348<br />
Total assets 6,538 1,500 8,038 5,696 — 5,696<br />
Current liabilities (948) — (948) (249) — (249)<br />
Non-current liabilities (3,300) — (3,300) (4,080) — (4,080)<br />
Net investment 2,290 1,500 3,790 1,367 — 1,367<br />
Joint<br />
ventures<br />
£’000<br />
2015 2014<br />
Associates<br />
£’000<br />
Total<br />
£’000<br />
Joint<br />
ventures<br />
£’000<br />
Associates<br />
£’000<br />
Revenue 458 — 458 485 — 485<br />
Administration and other expenses (175) — (175) (320) — (320)<br />
Increase in fair value of investment properties 690 — 690 1,002 — 1,002<br />
Operating profit 973 — 973 1,167 — 1,167<br />
Finance (costs)/income (50) — (50) 35 — 35<br />
Profit before tax 923 — 923 1,202 — 1,202<br />
Tax — — — (15) — (15)<br />
Share of profits after tax 923 — 923 1,187 — 1,187<br />
Details of the Group’s investments in joint ventures and associates are listed in note 35.<br />
16. Trade and other receivables<br />
Group<br />
2015<br />
£’000<br />
Parent Company<br />
Trade receivables 50,270 42,135 73 177<br />
Prepayments 12,326 4,606 672 159<br />
Amounts owed by related companies 2,359 8,161 — —<br />
Amounts owed by Group undertakings — — 196,966 193,866<br />
64,955 54,902 197,711 194,202<br />
Due within one year 54,448 50,065 197,711 194,202<br />
Due after more than one year 10,507 4,837 — —<br />
64,955 54,902 197,711 194,202<br />
Included in the Group’s trade receivable balance are receivables with a carrying amount of £4.3m (2014: £4.0m) which are past due<br />
at the reporting date and for which the Group has not provided, as there has not been a significant change in credit quality and the<br />
amounts are still considered recoverable. The Group does not hold any collateral over these balances.<br />
2014<br />
£’000<br />
2015<br />
£’000<br />
Total<br />
£’000<br />
Total<br />
£’000<br />
Total<br />
£’000<br />
2014<br />
£’000<br />
Shareholder Information Financial Statements<br />
Governance<br />
Strategic Report<br />
Overview<br />
115