

Cohesive Consistent Confident
4mZ0Bv
4mZ0Bv

Create successful ePaper yourself
Turn your PDF publications into a flip-book with our unique Google optimized e-Paper software.
Henry Boot PLC<br />
Annual Report and Financial Statements for the year ended 31 December 2015<br />
www.henryboot.co.uk<br />
Stock Code: BHY<br />
Financial Statements<br />
Notes to the Financial Statements continued<br />
for the year ended 31 December 2015<br />
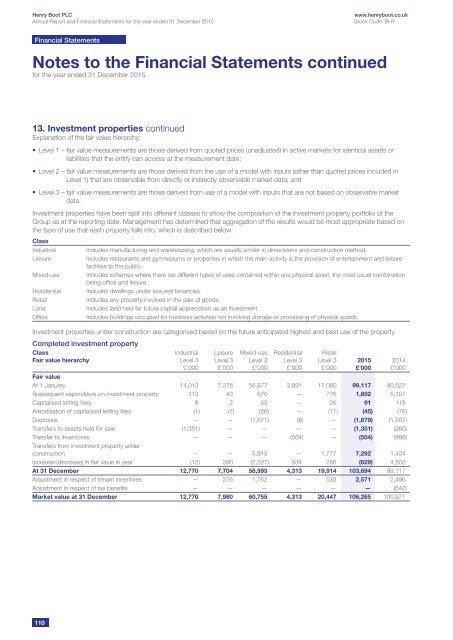
13. Investment properties continued<br />
Explanation of the fair value hierarchy:<br />
• Level 1 – fair value measurements are those derived from quoted prices (unadjusted) in active markets for identical assets or<br />
liabilities that the entity can access at the measurement date;<br />
• Level 2 – fair value measurements are those derived from the use of a model with inputs (other than quoted prices included in<br />
Level 1) that are observable from directly or indirectly observable market data; and<br />
• Level 3 – fair value measurements are those derived from use of a model with inputs that are not based on observable market<br />
data.<br />
Investment properties have been split into different classes to show the composition of the investment property portfolio of the<br />
Group as at the reporting date. Management has determined that aggregation of the results would be most appropriate based on<br />
the type of use that each property falls into, which is described below:<br />
Class<br />
Industrial<br />
Leisure<br />
Mixed-use<br />
Residential<br />
Retail<br />
Land<br />
Office<br />
Includes manufacturing and warehousing, which are usually similar in dimensions and construction method.<br />
Includes restaurants and gymnasiums or properties in which the main activity is the provision of entertainment and leisure<br />
facilities to the public.<br />
Includes schemes where there are different types of uses contained within one physical asset, the most usual combination<br />
being office and leisure.<br />
Includes dwellings under assured tenancies.<br />
Includes any property involved in the sale of goods.<br />
Includes land held for future capital appreciation as an investment.<br />
Includes buildings occupied for business activities not involving storage or processing of physical goods.<br />
Investment properties under construction are categorised based on the future anticipated highest and best use of the property.<br />
Completed investment property<br />
Class<br />
Fair value hierarchy<br />
Industrial<br />
Level 3<br />
£’000<br />
Leisure<br />
Level 3<br />
£’000<br />
Mixed-use<br />
Level 3<br />
£’000<br />
Residential<br />
Level 3<br />
£’000<br />
Retail<br />
Level 3<br />
£’000<br />
Fair value<br />
At 1 January 14,013 7,276 56,877 3,891 17,060 99,117 90,527<br />
Subsequent expenditure on investment property 113 43 670 — 776 1,602 5,107<br />
Capitalised letting fees 8 2 55 — 26 91 118<br />
Amortisation of capitalised letting fees (1) (7) (26) — (11) (45) (76)<br />
Disposals — — (1,871) (8) — (1,879) (1,507)<br />
Transfers to assets held for sale (1,351) — — — — (1,351) (260)<br />
Transfer to inventories — — — (504) — (504) (998)<br />
Transfers from investment property under<br />
construction — — 5,515 — 1,777 7,292 1,404<br />
Increase/(decrease) in fair value in year (12) 390 (2,227) 934 286 (629) 4,802<br />
At 31 December 12,770 7,704 58,993 4,313 19,914 103,694 99,117<br />
Adjustment in respect of tenant incentives — 276 1,762 — 533 2,571 2,496<br />
Adjustment in respect of tax benefits — — — — — — (642)<br />
Market value at 31 December 12,770 7,980 60,755 4,313 20,447 106,265 100,971<br />
2015<br />
£’000<br />
2014<br />
£’000<br />
110