

Cohesive Consistent Confident
4mZ0Bv
4mZ0Bv

Create successful ePaper yourself
Turn your PDF publications into a flip-book with our unique Google optimized e-Paper software.
Henry Boot PLC<br />
Annual Report and Financial Statements for the year ended 31 December 2015<br />
www.henryboot.co.uk<br />
Stock Code: BHY<br />
13. Investment properties continued<br />
There is no actively traded market for the Group’s commercial property and as such the adopted valuation is completed using the<br />
professional judgement of the Group’s professional valuers, who use the yield method to determine fair value. The calculation of<br />
the capital value of a property under this method uses a yield to multiple against the rental income stream with due allowance for<br />
a fixed assumed purchasers cost. The primary variables of the yield method are thus: the yield, which is based on historic yields<br />
for properties that are similar but to which there may be adjustment to take into account factors such as geographical location and<br />
lease terms; and the contracted rent, which is based on contracted rents that exist at the balance sheet date, but may also include<br />
a provision for rents that may be achieved in the future after account for a period of vacancy, such rents being based on rental<br />
income terms that exist in similar properties, adjusted for geographic location and lease terms.<br />
With the exception of the residential class, completed investment property has been revalued at 31 December 2015 by Jones<br />
Lang LaSalle Limited in accordance with the Practice Statements contained in the RICS Appraisal and Valuation Standards on<br />
the basis of market value at £101,952,000 (2014: £97,080,000). Jones Lang LaSalle Limited is a professional valuer who holds<br />
recognised and professional qualifications and has recent experience in the location and category of the investment property being<br />
valued. The valuation conforms to International Valuation Standards and was based on recent market transactions with similar<br />
characteristics and location using the yield method valuation technique. The yield method of valuation involves applying marketderived<br />
capitalisation yields, and the actual or market-derived future income streams where appropriate, with adjustments for letting<br />
voids or rent-free periods as applicable to each property. For all investment properties, their current use equates to the highest and<br />
best use.<br />
Residential properties are valued using recent comparable sales transactions with a significant unobservable input being the<br />
discount used, to reflect the lower value achieved where properties are held under an assured tenancy, that typically earn a low<br />
market level of rent. The discount applied recognises that the value is higher where the house is offered with the benefit of vacant<br />
possession at the end of the assured tenancy.<br />
The fair value of the residential class at 31 December 2015 has been determined by the Directors of the Company at £4,313,000<br />
(2014: £3,891,000). The fair value takes into account market evidence based on recent comparable sale transactions adjusted to<br />
take into account the tenanted nature of the properties.<br />
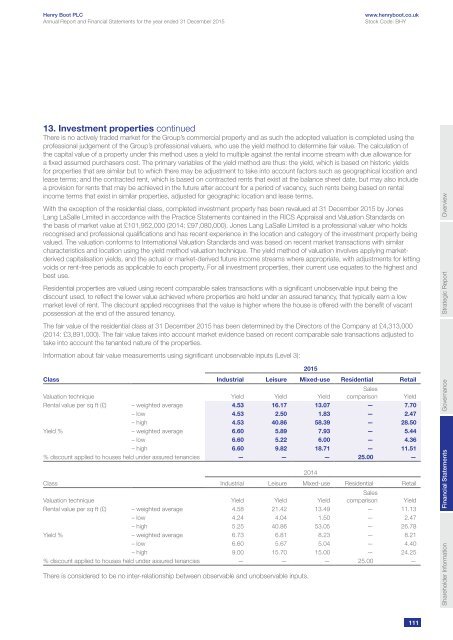
Information about fair value measurements using significant unobservable inputs (Level 3):<br />
Class Industrial Leisure Mixed-use Residential Retail<br />
Valuation technique Yield Yield Yield<br />
Sales<br />
comparison Yield<br />
Rental value per sq ft (£) – weighted average 4.53 16.17 13.07 — 7.70<br />
– low 4.53 2.50 1.83 — 2.47<br />
– high 4.53 40.86 58.39 — 28.50<br />
Yield % – weighted average 6.60 5.89 7.93 — 5.44<br />
– low 6.60 5.22 6.00 — 4.36<br />
– high 6.60 9.82 18.71 — 11.51<br />
% discount applied to houses held under assured tenancies — — — 25.00 —<br />
Class Industrial Leisure Mixed-use Residential Retail<br />
Valuation technique Yield Yield Yield<br />
Sales<br />
comparison Yield<br />
Rental value per sq ft (£) – weighted average 4.58 21.42 13.49 — 11.13<br />
– low 4.24 4.04 1.50 — 2.47<br />
– high 5.25 40.86 53.05 — 26.78<br />
Yield % – weighted average 6.73 6.81 8.23 — 8.21<br />
– low 6.60 5.67 5.04 — 4.40<br />
– high 9.00 15.70 15.00 — 24.25<br />
% discount applied to houses held under assured tenancies — — — 25.00 —<br />
There is considered to be no inter-relationship between observable and unobservable inputs.<br />
2015<br />
2014<br />
Shareholder Information Financial Statements<br />
Governance<br />
Strategic Report<br />
Overview<br />
111