

Cohesive Consistent Confident
4mZ0Bv
4mZ0Bv

You also want an ePaper? Increase the reach of your titles
YUMPU automatically turns print PDFs into web optimized ePapers that Google loves.
Henry Boot PLC<br />
Annual Report and Financial Statements for the year ended 31 December 2015<br />
www.henryboot.co.uk<br />
Stock Code: BHY<br />
Financial Statements<br />
Notes to the Financial Statements continued<br />
for the year ended 31 December 2015<br />
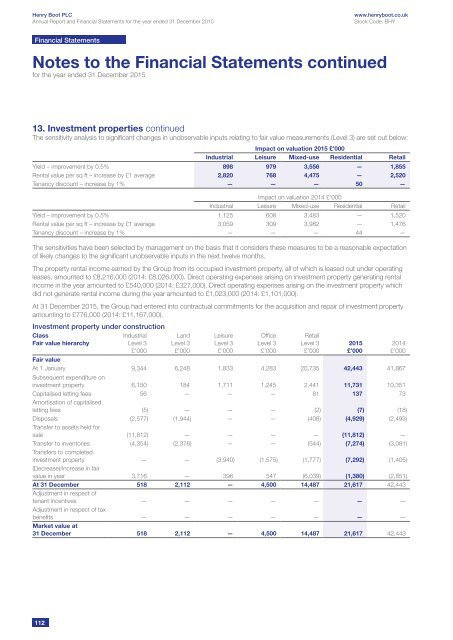
13. Investment properties continued<br />
The sensitivity analysis to significant changes in unobservable inputs relating to fair value measurements (Level 3) are set out below:<br />
Impact on valuation 2015 £’000<br />
Industrial Leisure Mixed-use Residential Retail<br />
Yield – improvement by 0.5% 898 979 3,556 — 1,855<br />
Rental value per sq ft – increase by £1 average 2,820 768 4,475 — 2,520<br />
Tenancy discount – increase by 1% — — — 50 —<br />
Impact on valuation 2014 £’000<br />
Industrial Leisure Mixed-use Residential Retail<br />
Yield – improvement by 0.5% 1,125 608 3,483 — 1,520<br />
Rental value per sq ft – increase by £1 average 3,059 309 3,982 — 1,476<br />
Tenancy discount – increase by 1% — — — 44 —<br />
The sensitivities have been selected by management on the basis that it considers these measures to be a reasonable expectation<br />
of likely changes to the significant unobservable inputs in the next twelve months.<br />
The property rental income earned by the Group from its occupied investment property, all of which is leased out under operating<br />
leases, amounted to £8,216,000 (2014: £8,026,000). Direct operating expenses arising on investment property generating rental<br />
income in the year amounted to £540,000 (2014: £327,000). Direct operating expenses arising on the investment property which<br />
did not generate rental income during the year amounted to £1,023,000 (2014: £1,101,000).<br />
At 31 December 2015, the Group had entered into contractual commitments for the acquisition and repair of investment property<br />
amounting to £776,000 (2014: £11,167,000).<br />
Investment property under construction<br />
Class<br />
Fair value hierarchy<br />
Industrial<br />
Level 3<br />
£’000<br />
Land<br />
Level 3<br />
£’000<br />
Leisure<br />
Level 3<br />
£’000<br />
Office<br />
Level 3<br />
£’000<br />
Retail<br />
Level 3<br />
£’000<br />
Fair value<br />
At 1 January 9,344 6,248 1,833 4,283 20,735 42,443 41,867<br />
Subsequent expenditure on<br />
investment property 6,150 184 1,711 1,245 2,441 11,731 10,351<br />
Capitalised letting fees 56 — — — 81 137 73<br />
Amortisation of capitalised<br />
letting fees (5) — — — (2) (7) (18)<br />
Disposals (2,577) (1,944) — — (408) (4,929) (2,493)<br />
Transfer to assets held for<br />
sale (11,812) — — — — (11,812) —<br />
Transfer to inventories (4,354) (2,376) — — (544) (7,274) (3,081)<br />
Transfers to completed<br />
investment property — — (3,940) (1,575) (1,777) (7,292) (1,405)<br />
(Decrease)/increase in fair<br />
value in year 3,716 — 396 547 (6,039) (1,380) (2,851)<br />
At 31 December 518 2,112 — 4,500 14,487 21,617 42,443<br />
Adjustment in respect of<br />
tenant incentives — — — — — — —<br />
Adjustment in respect of tax<br />
benefits — — — — — — —<br />
Market value at<br />
31 December 518 2,112 — 4,500 14,487 21,617 42,443<br />
2015<br />
£’000<br />
2014<br />
£’000<br />
112