

Cohesive Consistent Confident
4mZ0Bv
4mZ0Bv

Create successful ePaper yourself
Turn your PDF publications into a flip-book with our unique Google optimized e-Paper software.
Henry Boot PLC<br />
Annual Report and Financial Statements for the year ended 31 December 2015<br />
www.henryboot.co.uk<br />
Stock Code: BHY<br />
Financial Statements<br />
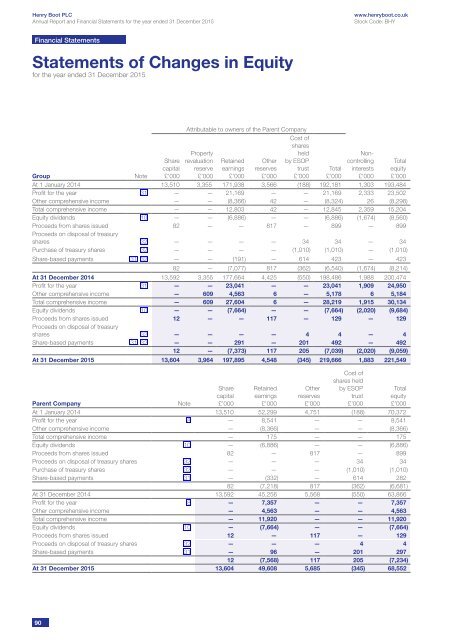
Statements of Changes in Equity<br />
for the year ended 31 December 2015<br />
Group<br />
Note<br />
Share<br />
capital<br />
£’000<br />
Attributable to owners of the Parent Company<br />
Property<br />
revaluation<br />
reserve<br />
£’000<br />
Retained<br />
earnings<br />
£’000<br />
Other<br />
reserves<br />
£’000<br />
Cost of<br />
shares<br />
held<br />
by ESOP<br />
trust<br />
£’000<br />
Total<br />
£’000<br />
Noncontrolling<br />
interests<br />
£’000<br />
At 1 January 2014 13,510 3,355 171,938 3,566 (188) 192,181 1,303 193,484<br />
Profit for the year 31 — — 21,169 — — 21,169 2,333 23,502<br />
Other comprehensive income — — (8,366) 42 — (8,324) 26 (8,298)<br />
Total comprehensive income — — 12,803 42 — 12,845 2,359 15,204<br />
Equity dividends 10 — — (6,886) — — (6,886) (1,674) (8,560)<br />
Proceeds from shares issued 82 — — 817 — 899 — 899<br />
Proceeds on disposal of treasury<br />
shares 32 — — — — 34 34 — 34<br />
Purchase of treasury shares 32 — — — — (1,010) (1,010) — (1,010)<br />
Share-based payments 31, 32 — — (191) — 614 423 — 423<br />
82 — (7,077) 817 (362) (6,540) (1,674) (8,214)<br />
At 31 December 2014 13,592 3,355 177,664 4,425 (550) 198,486 1,988 200,474<br />
Profit for the year 31 — — 23,041 — — 23,041 1,909 24,950<br />
Other comprehensive income — 609 4,563 6 — 5,178 6 5,184<br />
Total comprehensive income — 609 27,604 6 — 28,219 1,915 30,134<br />
Equity dividends 10 — — (7,664) — — (7,664) (2,020) (9,684)<br />
Proceeds from shares issued 12 — — 117 — 129 — 129<br />
Proceeds on disposal of treasury<br />
shares 32 — — — — 4 4 — 4<br />
Share-based payments 31, 32 — — 291 — 201 492 — 492<br />
12 — (7,373) 117 205 (7,039) (2,020) (9,059)<br />
At 31 December 2015 13,604 3,964 197,895 4,548 (345) 219,666 1,883 221,549<br />
Parent Company<br />
Note<br />
Share<br />
capital<br />
£’000<br />
Retained<br />
earnings<br />
£’000<br />
Other<br />
reserves<br />
£’000<br />
Cost of<br />
shares held<br />
by ESOP<br />
trust<br />
£’000<br />
At 1 January 2014 13,510 52,299 4,751 (188) 70,372<br />
Profit for the year 8 — 8,541 — — 8,541<br />
Other comprehensive income — (8,366) — — (8,366)<br />
Total comprehensive income — 175 — — 175<br />
Equity dividends 10 — (6,886) — — (6,886)<br />
Proceeds from shares issued 82 — 817 — 899<br />
Proceeds on disposal of treasury shares 32 — — — 34 34<br />
Purchase of treasury shares 32 — — — (1,010) (1,010)<br />
Share-based payments 31 — (332) — 614 282<br />
82 (7,218) 817 (362) (6,681)<br />
At 31 December 2014 13,592 45,256 5,568 (550) 63,866<br />
Profit for the year 8 — 7,357 — — 7,357<br />
Other comprehensive income — 4,563 — — 4,563<br />
Total comprehensive income — 11,920 — — 11,920<br />
Equity dividends 10 — (7,664) — — (7,664)<br />
Proceeds from shares issued 12 — 117 — 129<br />
Proceeds on disposal of treasury shares 32 — — — 4 4<br />
Share-based payments 31 — 96 — 201 297<br />
12 (7,568) 117 205 (7,234)<br />
At 31 December 2015 13,604 49,608 5,685 (345) 68,552<br />
Total<br />
equity<br />
£’000<br />
Total<br />
equity<br />
£’000<br />
90