

Cohesive Consistent Confident
4mZ0Bv
4mZ0Bv

Create successful ePaper yourself
Turn your PDF publications into a flip-book with our unique Google optimized e-Paper software.
Henry Boot PLC<br />
Annual Report and Financial Statements for the year ended 31 December 2015<br />
www.henryboot.co.uk<br />
Stock Code: BHY<br />
Overview Strategic Report<br />
Key Performance Indicators<br />
Financial<br />
Each business unit within the Group is required to establish targets at the beginning of each<br />
financial year against a broad range of financial and non-financial indicators.<br />
The Managing Director of each subsidiary reports on progress at Board meetings every two months. The two main Board<br />
Executive Directors attend these meetings and are able to assess whether each unit is performing in accordance with its plan<br />
throughout the year.<br />
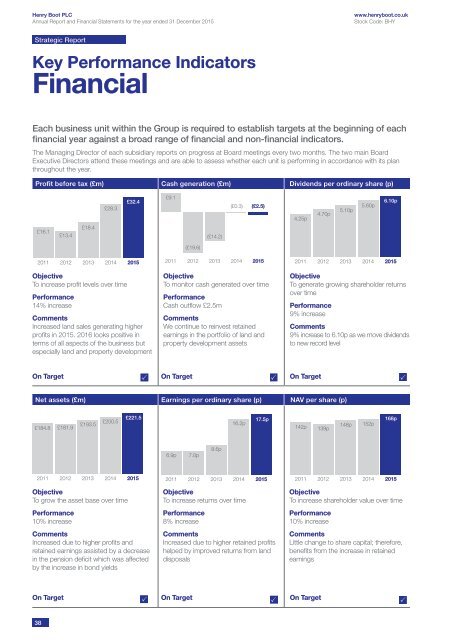
Profit before tax (£m) Cash generation (£m) Dividends per ordinary share (p)<br />
£28.3<br />
£32.4<br />
£9.1<br />
(£0.3)<br />
(£2.5)<br />
4.25p<br />
4.70p<br />
5.10p<br />
5.60p<br />
6.10p<br />
£16.1<br />
£13.4<br />
£18.4<br />
(£14.2)<br />
(£19.6)<br />
2011<br />
2012<br />
2013<br />
2014<br />
2015<br />
2011<br />
2012<br />
2013<br />
2014<br />
2015<br />
2011<br />
2012<br />
2013<br />
2014<br />
2015<br />
Objective<br />
To increase profit levels over time<br />
Performance<br />
14% increase<br />
Comments<br />
Increased land sales generating higher<br />
profits in 2015. 2016 looks positive in<br />
terms of all aspects of the business but<br />
especially land and property development<br />
Objective<br />
To monitor cash generated over time<br />
Performance<br />
Cash outflow £2.5m<br />
Comments<br />
We continue to reinvest retained<br />
earnings in the portfolio of land and<br />
property development assets<br />
Objective<br />
To generate growing shareholder returns<br />
over time<br />
Performance<br />
9% increase<br />
Comments<br />
9% increase to 6.10p as we move dividends<br />
to new record level<br />
On Target On Target On Target<br />
Net assets (£m) Earnings per ordinary share (p) NAV per share (p)<br />
£184.8<br />
£181.9<br />
£193.5<br />
£200.5<br />
£221.5<br />
16.2p<br />
17.5p<br />
142p<br />
139p<br />
148p<br />
152p<br />
168p<br />
6.9p<br />
7.0p<br />
8.6p<br />
2011<br />
2012<br />
2013<br />
2014<br />
2015<br />
2011<br />
2012<br />
2013<br />
2014<br />
2015<br />
2011<br />
2012<br />
2013<br />
2014<br />
2015<br />
Objective<br />
To grow the asset base over time<br />
Performance<br />
10% increase<br />
Comments<br />
Increased due to higher profits and<br />
retained earnings assisted by a decrease<br />
in the pension deficit which was affected<br />
by the increase in bond yields<br />
Objective<br />
To increase returns over time<br />
Performance<br />
8% increase<br />
Comments<br />
Increased due to higher retained profits<br />
helped by improved returns from land<br />
disposals<br />
Objective<br />
To increase shareholder value over time<br />
Performance<br />
10% increase<br />
Comments<br />
Little change to share capital; therefore,<br />
benefits from the increase in retained<br />
earnings<br />
On Target On Target On Target<br />
38