

On the Spectrum
2lm5UyR
2lm5UyR

Create successful ePaper yourself
Turn your PDF publications into a flip-book with our unique Google optimized e-Paper software.
From Chronnectivity To Chronnectopathy: Connectivity Dynamics of Typical Development<br />
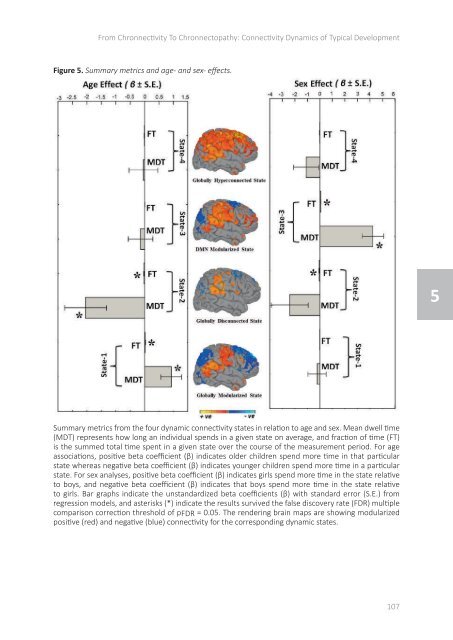
Figure 5. Summary metrics and age- and sex- effects.<br />
5<br />
Summary metrics from <strong>the</strong> four dynamic connectivity states in relation to age and sex. Mean dwell time<br />
(MDT) represents how long an individual spends in a given state on average, and fraction of time (FT)<br />
is Figure <strong>the</strong> summed 5. Summary total time metrics spent in and a given age- state and over sex- <strong>the</strong> effects. course of Summary <strong>the</strong> measurement metrics period. from <strong>the</strong> For four age<br />
associations, positive beta coefficient (β) indicates older children spend more time in that particular<br />
state whereas negative beta coefficient (β) indicates younger children spend more time in a particular<br />
dynamic connectivity states in relation to age and sex. Mean dwell time (MDT)<br />
state. For sex analyses, positive beta coefficient (β) indicates girls spend more time in <strong>the</strong> state relative<br />
to boys, and negative beta coefficient (β) indicates that boys spend more time in <strong>the</strong> state relative<br />
to represents girls. Bar graphs how long indicate an individual <strong>the</strong> unstandardized spends in beta a given coefficients state on (β) average, with standard fraction error (S.E.) of from time<br />
regression models, and asterisks (*) indicate <strong>the</strong> results survived <strong>the</strong> false discovery rate (FDR) multiple<br />
comparison (FT) <strong>the</strong> correction summed threshold total time of spent pFDR = in 0.05. a given The rendering state over brain <strong>the</strong> maps course are of showing <strong>the</strong> measurement<br />
modularized<br />
positive (red) and negative (blue) connectivity for <strong>the</strong> corresponding dynamic states.<br />
period. For age associations, positive beta coefficient (β) indicates older children spend<br />
more time in that particular state whereas negative beta coefficient (β) indicates younger<br />
children spend more time in a particular state. For sex analyses, positive beta coefficient<br />
107<br />
34