- Page 1 and 2:
On the Spectrum the neurobiology of
- Page 3 and 4:
ISBN: 978-94-6233-336-9 © Laura Bl
- Page 5 and 6:
PROMOTIECOMMISSIE Promotoren Overig
- Page 8:
MANUSCRIPTS THAT FORM THE BASIS OF
- Page 11 and 12:
Chapter 1 10
- Page 13 and 14:
Chapter 1 Cuthbert, Garvey, Heinsse
- Page 15 and 16:
Chapter 1 folding of the brain into
- Page 17 and 18:
Chapter 1 beneficial for treatment
- Page 19 and 20:
Chapter 1 REFERENCES Achenbach, T.
- Page 21 and 22:
Chapter 1 Sonuga-Barke, E. J. S.
- Page 24:
IPart I: The neurobiology of autist
- Page 27 and 28:
Chapter 2 ABSTRACT Objective: Recen
- Page 29 and 30:
Chapter 2 Hardan 2010) and right pa
- Page 31 and 32:
Chapter 2 Statistical analysis To i
- Page 33 and 34:
Chapter 2 Gyrification Six regions
- Page 35 and 36:
Chapter 2 The association remained
- Page 37 and 38:
Chapter 2 Table 4. Autistic traits
- Page 39 and 40:
Chapter 2 While we found widespread
- Page 41 and 42:
Chapter 2 REFERENCES Amaral, D. G.,
- Page 43 and 44:
Chapter 2 Wallace, G. L., P. Shaw,
- Page 45 and 46:
Chapter 2 South-West of the Netherl
- Page 47 and 48:
Chapter 2 Supplementary Figure 1. F
- Page 49 and 50:
Chapter 2 Supplementary Figure 3. G
- Page 51 and 52:
Chapter 2 Supplementary Figure 5. C
- Page 53 and 54:
Chapter 2 Supplementary Table 1. No
- Page 55 and 56:
Chapter 2 Supplementary Table 3. Ca
- Page 58 and 59: 3 A Prospective Study of Fetal Head
- Page 60 and 61: A Prospective Study of Fetal Head G
- Page 62 and 63: A Prospective Study of Fetal Head G
- Page 64 and 65: A Prospective Study of Fetal Head G
- Page 66 and 67: A Prospective Study of Fetal Head G
- Page 68 and 69: A Prospective Study of Fetal Head G
- Page 70 and 71: A Prospective Study of Fetal Head G
- Page 72 and 73: A Prospective Study of Fetal Head G
- Page 74 and 75: A Prospective Study of Fetal Head G
- Page 76: A Prospective Study of Fetal Head G
- Page 79 and 80: Chapter 4 ABSTRACT Background: Auti
- Page 81 and 82: Chapter 4 An important trend concep
- Page 83 and 84: Chapter 4 the 18-item abbreviated v
- Page 85 and 86: Chapter 4 data were aligned into a
- Page 87 and 88: Chapter 4 Autistic traits and white
- Page 89 and 90: Chapter 4 Table 4. TBSS: autistic t
- Page 91 and 92: Chapter 4 of group differences rela
- Page 93 and 94: Chapter 4 Cook, P. A., Y. Bai, S. N
- Page 95 and 96: Chapter 4 White, T., H. El Marroun,
- Page 98 and 99: 5 From Chronnectivity To Chronnecto
- Page 100 and 101: From Chronnectivity To Chronnectopa
- Page 102 and 103: From Chronnectivity To Chronnectopa
- Page 104 and 105: From Chronnectivity To Chronnectopa
- Page 106 and 107: From Chronnectivity To Chronnectopa
- Page 110 and 111: From Chronnectivity To Chronnectopa
- Page 112 and 113: From Chronnectivity To Chronnectopa
- Page 114 and 115: From Chronnectivity To Chronnectopa
- Page 116 and 117: From Chronnectivity To Chronnectopa
- Page 118 and 119: From Chronnectivity To Chronnectopa
- Page 120 and 121: From Chronnectivity To Chronnectopa
- Page 122 and 123: From Chronnectivity To Chronnectopa
- Page 124 and 125: From Chronnectivity To Chronnectopa
- Page 126 and 127: From Chronnectivity To Chronnectopa
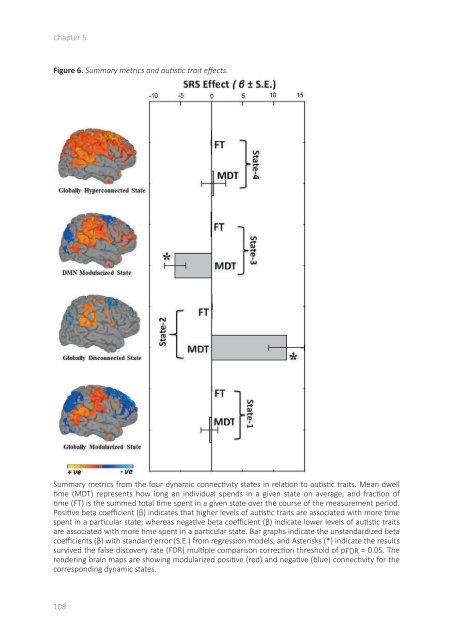
- Page 128 and 129: nalysis did not reveal any FDR-corr
- Page 130: From Chronnectivity To Chronnectopa
- Page 134 and 135: 6 Cognitive functioning in children
- Page 136 and 137: Cognitive functioning in children w
- Page 138 and 139: Cognitive functioning in children w
- Page 140 and 141: Cognitive functioning in children w
- Page 142 and 143: Cognitive functioning in children w
- Page 144 and 145: Cognitive functioning in children w
- Page 146 and 147: Cognitive functioning in children w
- Page 148 and 149: Cognitive functioning in children w
- Page 150 and 151: Cognitive functioning in children w
- Page 152 and 153: Cognitive functioning in children w
- Page 154 and 155: Cognitive functioning in children w
- Page 156 and 157: Cognitive functioning in children w
- Page 158 and 159:
Cognitive functioning in children w
- Page 160 and 161:
Cognitive functioning in children w
- Page 162 and 163:
Cognitive functioning in children w
- Page 164:
Cognitive functioning in children w
- Page 167 and 168:
Chapter 7 ABSTRACT Objectives: In c
- Page 169 and 170:
Chapter 7 profile analysis performe
- Page 171 and 172:
Chapter 7 have been demonstrated pr
- Page 173 and 174:
Chapter 7 Next, we examined associa
- Page 175 and 176:
Chapter 7 Table 2 Brain morphology
- Page 177 and 178:
Chapter 7 Table 3 Cortical thicknes
- Page 179 and 180:
Chapter 7 Our finding was suggestiv
- Page 181 and 182:
Chapter 7 Using empirically defined
- Page 183 and 184:
Chapter 7 Fischl, B. and A. M. Dale
- Page 185 and 186:
Chapter 7 Supplement Table 1 Brain
- Page 188:
IIIPart III
- Page 191 and 192:
Chapter 8 190
- Page 193 and 194:
Chapter 8 stable relationships, and
- Page 195 and 196:
Chapter 8 gyrification changes in p
- Page 197 and 198:
Chapter 8 genetic or environmental
- Page 199 and 200:
Chapter 8 diseases, according to th
- Page 201 and 202:
Chapter 8 ability may be even more
- Page 203 and 204:
Chapter 8 symptoms could be more sp
- Page 205 and 206:
Chapter 8 association of maternal v
- Page 207 and 208:
Chapter 8 REFERENCES Abrahams, B. S
- Page 209 and 210:
Chapter 8 Goddard, M. N., S. van Ri
- Page 211 and 212:
Chapter 8 Sebat, J., B. Lakshmi, D.
- Page 214 and 215:
SSummary Samenvatting
- Page 216 and 217:
Summary SUMMARY Despite evidence fr
- Page 218 and 219:
Summary along a continuum were used
- Page 220 and 221:
Samenvatting SAMENVATTING Genetisch
- Page 222:
Samenvatting jonge kinderen die zic
- Page 225 and 226:
224
- Page 227 and 228:
Addendum Mous SE, Schoemaker NK, Bl
- Page 229 and 230:
228
- Page 231 and 232:
Addendum Zoeken in andere databases
- Page 233 and 234:
Addendum School of Women’s and In
- Page 235 and 236:
234
- Page 237 and 238:
Addendum Graag wil ik Dr. Marion Sm
- Page 239 and 240:
Addendum hebben. Dank in het bijzon
- Page 241 and 242:
240