

On the Spectrum
2lm5UyR
2lm5UyR

Create successful ePaper yourself
Turn your PDF publications into a flip-book with our unique Google optimized e-Paper software.
Chapter 3<br />
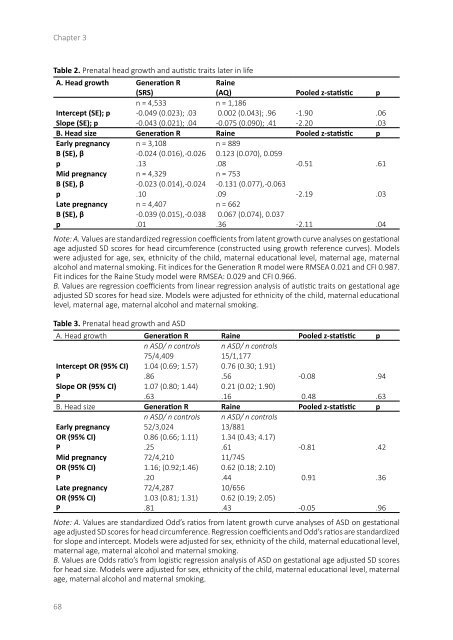
Table 2. Prenatal head growth and autistic traits later in life<br />
A. Head growth Generation R Raine<br />
(SRS) (AQ) Pooled z-statistic p<br />
n = 4,533 n = 1,186<br />
Intercept (SE); p -0.049 (0.023); .03 0.002 (0.043); .96 -1.90 .06<br />
Slope (SE); p -0.043 (0.021); .04 -0.075 (0.090); .41 -2.20 .03<br />
B. Head size Generation R Raine Pooled z-statistic p<br />
Early pregnancy n = 3,108 n = 889<br />
B (SE), β -0.024 (0.016),-0.026 0.123 (0.070), 0.059<br />
p .13 .08 -0.51 .61<br />
Mid pregnancy n = 4,329 n = 753<br />
B (SE), β -0.023 (0.014),-0.024 -0.131 (0.077),-0.063<br />
p .10 .09 -2.19 .03<br />
Late pregnancy n = 4,407 n = 662<br />
B (SE), β -0.039 (0.015),-0.038 0.067 (0.074), 0.037<br />
p .01 .36 -2.11 .04<br />
Note: A. Values are standardized regression coefficients from latent growth curve analyses on gestational<br />
age adjusted SD scores for head circumference (constructed using growth reference curves). Models<br />
were adjusted for age, sex, ethnicity of <strong>the</strong> child, maternal educational level, maternal age, maternal<br />
alcohol and maternal smoking. Fit indices for <strong>the</strong> Generation R model were RMSEA 0.021 and CFI 0.987.<br />
Fit indices for <strong>the</strong> Raine Study model were RMSEA: 0.029 and CFI 0.966.<br />
B. Values are regression coefficients from linear regression analysis of autistic traits on gestational age<br />
adjusted SD scores for head size. Models were adjusted for ethnicity of <strong>the</strong> child, maternal educational<br />
level, maternal age, maternal alcohol and maternal smoking.<br />
Table 3. Prenatal head growth and ASD<br />
A. Head growth Generation R Raine Pooled z-statistic p<br />
n ASD/ n controls n ASD/ n controls<br />
75/4,409 15/1,177<br />
Intercept OR (95% CI) 1.04 (0.69; 1.57) 0.76 (0.30; 1.91)<br />
P .86 .56 -0.08 .94<br />
Slope OR (95% CI) 1.07 (0.80; 1.44) 0.21 (0.02; 1.90)<br />
P .63 .16 0.48 .63<br />
B. Head size Generation R Raine Pooled z-statistic p<br />
n ASD/ n controls n ASD/ n controls<br />
Early pregnancy 52/3,024 13/881<br />
OR (95% CI) 0.86 (0.66; 1.11) 1.34 (0.43; 4.17)<br />
P .25 .61 -0.81 .42<br />
Mid pregnancy 72/4,210 11/745<br />
OR (95% CI) 1.16; (0.92;1.46) 0.62 (0.18; 2.10)<br />
P .20 .44 0.91 .36<br />
Late pregnancy 72/4,287 10/656<br />
OR (95% CI) 1.03 (0.81; 1.31) 0.62 (0.19; 2.05)<br />
P .81 .43 -0.05 .96<br />
Note: A. Values are standardized Odd’s ratios from latent growth curve analyses of ASD on gestational<br />
age adjusted SD scores for head circumference. Regression coefficients and Odd’s ratios are standardized<br />
for slope and intercept. Models were adjusted for sex, ethnicity of <strong>the</strong> child, maternal educational level,<br />
maternal age, maternal alcohol and maternal smoking.<br />
B. Values are Odds ratio’s from logistic regression analysis of ASD on gestational age adjusted SD scores<br />
for head size. Models were adjusted for sex, ethnicity of <strong>the</strong> child, maternal educational level, maternal<br />
age, maternal alcohol and maternal smoking.<br />
68