Indiana State Health Improvement Plan (I-SHIP) - State of Indiana
Indiana State Health Improvement Plan (I-SHIP) - State of Indiana
Indiana State Health Improvement Plan (I-SHIP) - State of Indiana

Create successful ePaper yourself
Turn your PDF publications into a flip-book with our unique Google optimized e-Paper software.
INDIANA STATE HEALTH IMPROVEMENT PLAN<br />
Partnering for the Public’s <strong>Health</strong><br />
In addition, other minority groups and special populations live in<br />
<strong>Indiana</strong>, and represent special populations that are recognized within the<br />
context <strong>of</strong> health improvement planning. These include Native<br />
Americans, Amish, and Burmese, as well as migrant seasonal farm<br />
workers in some counties.<br />
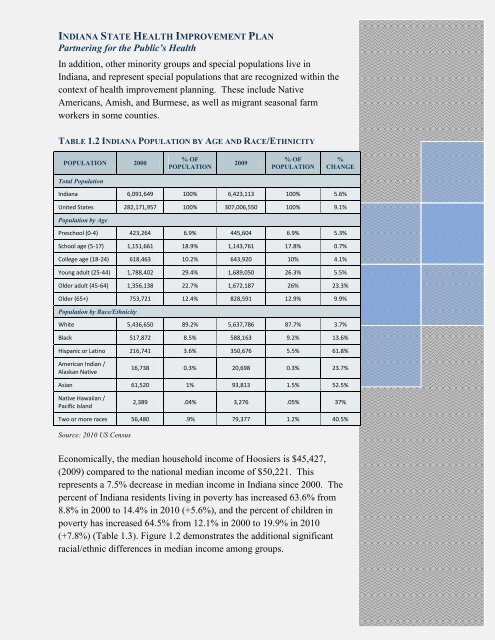
TABLE 1.2 INDIANA POPULATION BY AGE AND RACE/ETHNICITY<br />
POPULATION 2000<br />
Total Population<br />
% OF<br />
POPULATION<br />
2009<br />
% OF<br />
POPULATION<br />
%<br />
CHANGE<br />
<strong>Indiana</strong> 6,091,649 100% 6,423,113 100% 5.6%<br />
United <strong>State</strong>s 282,171,957 100% 307,006,550 100% 9.1%<br />
Population by Age<br />
Preschool (0-4) 423,264 6.9% 445,604 6.9% 5.3%<br />
School age (5-17) 1,151,661 18.9% 1,143,761 17.8% 0.7%<br />
College age (18-24) 618,463 10.2% 643,920 10% 4.1%<br />
Young adult (25-44) 1,788,402 29.4% 1,689,050 26.3% 5.5%<br />
Older adult (45-64) 1,356,138 22.7% 1,672,187 26% 23.3%<br />
Older (65+) 753,721 12.4% 828,591 12.9% 9.9%<br />
Population by Race/Ethnicity<br />
White 5,436,650 89.2% 5,637,786 87.7% 3.7%<br />
Black 517,872 8.5% 588,163 9.2% 13.6%<br />
Hispanic or Latino 216,741 3.6% 350,676 5.5% 61.8%<br />
American Indian /<br />
Alaskan Native<br />
16,738 0.3% 20,698 0.3% 23.7%<br />
Asian 61,520 1% 93,813 1.5% 52.5%<br />
Native Hawaiian /<br />
Pacific Island<br />
2,389 .04% 3,276 .05% 37%<br />
Two or more races 56,480 .9% 79,377 1.2% 40.5%<br />
Source: 2010 US Census<br />
Economically, the median household income <strong>of</strong> Hoosiers is $45,427,<br />
(2009) compared to the national median income <strong>of</strong> $50,221. This<br />
represents a 7.5% decrease in median income in <strong>Indiana</strong> since 2000. The<br />
percent <strong>of</strong> <strong>Indiana</strong> residents living in poverty has increased 63.6% from<br />
8.8% in 2000 to 14.4% in 2010 (+5.6%), and the percent <strong>of</strong> children in<br />
poverty has increased 64.5% from 12.1% in 2000 to 19.9% in 2010<br />
(+7.8%) (Table 1.3). Figure 1.2 demonstrates the additional significant<br />
racial/ethnic differences in median income among groups.