Indiana State Health Improvement Plan (I-SHIP) - State of Indiana
Indiana State Health Improvement Plan (I-SHIP) - State of Indiana
Indiana State Health Improvement Plan (I-SHIP) - State of Indiana

You also want an ePaper? Increase the reach of your titles
YUMPU automatically turns print PDFs into web optimized ePapers that Google loves.
INDIANA STATE HEALTH IMPROVEMENT PLAN<br />
Partnering for the Public’s <strong>Health</strong><br />
MEASURING HEALTH STATUS IN INDIANA<br />
LEADING HEALTH INDICATORS<br />
This section provides an overview <strong>of</strong> the leading issues that affect the<br />
health status <strong>of</strong> residents <strong>of</strong> <strong>Indiana</strong>. The health status <strong>of</strong> the state is a<br />
description <strong>of</strong> the health <strong>of</strong> its population. The information used to report<br />
health status comes from a variety <strong>of</strong> sources, including birth and death<br />
records; hospital discharge data; and health information collected from<br />
health care records, personal interviews, physical examinations, and<br />
telephone surveys.<br />
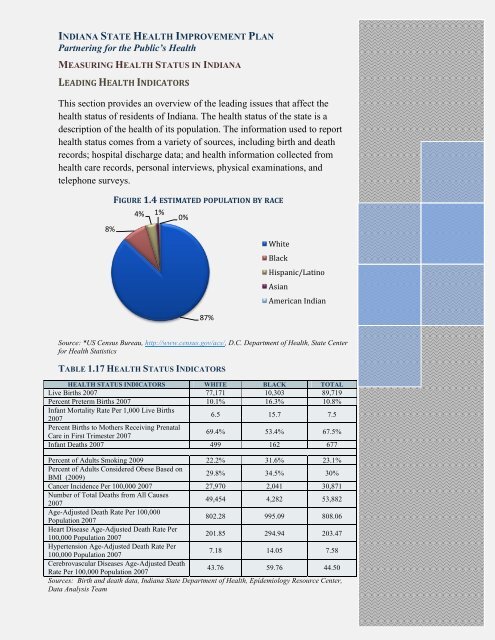
8%<br />
FIGURE 1.4 ESTIMATED POPULATION BY RACE<br />
4% 1%<br />
0%<br />
Source: *US Census Bureau, http://www.census.gov/acs/, D.C. Department <strong>of</strong> <strong>Health</strong>, <strong>State</strong> Center<br />
for <strong>Health</strong> Statistics<br />
TABLE 1.17 HEALTH STATUS INDICATORS<br />
HEALTH STATUS INDICATORS WHITE BLACK TOTAL<br />
Live Births 2007 77,171 10,303 89,719<br />
Percent Preterm Births 2007 10.1% 16.3% 10.8%<br />
Infant Mortality Rate Per 1,000 Live Births<br />
2007<br />
6.5 15.7 7.5<br />
Percent Births to Mothers Receiving Prenatal<br />
Care in First Trimester 2007<br />
69.4% 53.4% 67.5%<br />
Infant Deaths 2007 499 162 677<br />
Percent <strong>of</strong> Adults Smoking 2009 22.2% 31.6% 23.1%<br />
Percent <strong>of</strong> Adults Considered Obese Based on<br />
BMI (2009)<br />
29.8% 34.5% 30%<br />
Cancer Incidence Per 100,000 2007 27,970 2,041 30,871<br />
Number <strong>of</strong> Total Deaths from All Causes<br />
2007<br />
49,454 4,282 53,882<br />
Age-Adjusted Death Rate Per 100,000<br />
Population 2007<br />
802.28 995.09 808.06<br />
Heart Disease Age-Adjusted Death Rate Per<br />
100,000 Population 2007<br />
201.85 294.94 203.47<br />
Hypertension Age-Adjusted Death Rate Per<br />
100,000 Population 2007<br />
7.18 14.05 7.58<br />
Cerebrovascular Diseases Age-Adjusted Death<br />
Rate Per 100,000 Population 2007<br />
43.76 59.76 44.50<br />
Sources: Birth and death data, <strong>Indiana</strong> <strong>State</strong> Department <strong>of</strong> <strong>Health</strong>, Epidemiology Resource Center,<br />
Data Analysis Team<br />
87%<br />
White<br />
Black<br />
Hispanic/Latino<br />
Asian<br />
American Indian