Hydrocarbon Vision 2030 (ஹைட்ரோகார்பன் தொலைநோக்கு ஆவணம் 2030)

You also want an ePaper? Increase the reach of your titles
YUMPU automatically turns print PDFs into web optimized ePapers that Google loves.
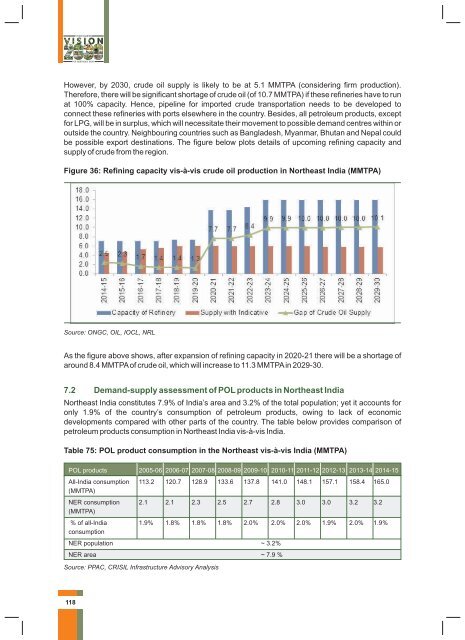
However, by <strong>2030</strong>, crude oil supply is likely to be at 5.1 MMTPA (considering firm production).<br />
Therefore, there will be significant shortage of crude oil (of 10.7 MMTPA) if these refineries have to run<br />
at 100% capacity. Hence, pipeline for imported crude transportation needs to be developed to<br />
connect these refineries with ports elsewhere in the country. Besides, all petroleum products, except<br />
for LPG, will be in surplus, which will necessitate their movement to possible demand centres within or<br />
outside the country. Neighbouring countries such as Bangladesh, Myanmar, Bhutan and Nepal could<br />
be possible export destinations. The figure below plots details of upcoming refining capacity and<br />
supply of crude from the region.<br />
Figure 36: Refining capacity vis-à-vis crude oil production in Northeast India (MMTPA)<br />
Source: ONGC, OIL, IOCL, NRL<br />
As the figure above shows, after expansion of refining capacity in 2020-21 there will be a shortage of<br />
around 8.4 MMTPA of crude oil, which will increase to 11.3 MMTPA in 2029-30.<br />
7.2 Demand-supply assessment of POL products in Northeast India<br />
Northeast India constitutes 7.9% of India’s area and 3.2% of the total population; yet it accounts for<br />
only 1.9% of the country’s consumption of petroleum products, owing to lack of economic<br />
developments compared with other parts of the country. The table below provides comparison of<br />
petroleum products consumption in Northeast India vis-à-vis India.<br />
Table 75: POL product consumption in the Northeast vis-à-vis India (MMTPA)<br />
POL products 2005-06 2006-07 2007-08 2008-09 2009-10 2010-11 2011-12 2012-13 2013-14 2014-15<br />
All-India consumption 113.2 120.7 128.9 133.6 137.8 141.0 148.1 157.1 158.4 165.0<br />
(MMTPA)<br />
NER consumption 2.1 2.1 2.3 2.5 2.7 2.8 3.0 3.0 3.2 3.2<br />
(MMTPA)<br />
% of all-India 1.9% 1.8% 1.8% 1.8% 2.0% 2.0% 2.0% 1.9% 2.0% 1.9%<br />
consumption<br />
NER population ~ 3.2%<br />
NER area ~ 7.9 %<br />
Source: PPAC, CRISIL Infrastructure Advisory Analysis<br />
118