- Page 1 and 2:
Double the production of Oil and Na
- Page 3 and 4:
6.3.1 Existing pipelines 97 6.3.2 U
- Page 5 and 6:
12.2.5 Other industries around oil
- Page 7 and 8:
Message from Hon’ble Minister Shr
- Page 9 and 10:
Preface & Acknowledgments Shri Ajay
- Page 11:
Prologue Shri U P Singh, IAS, (Addi
- Page 14 and 15: 1. Executive summary The North East
- Page 16 and 17: Policymakers and economists have re
- Page 18 and 19: Challenges in northeastern region K
- Page 20 and 21: Action plan Rationale Responsible a
- Page 22 and 23: Action plan Rationale Responsible a
- Page 24 and 25: Action plan Rationale Responsible a
- Page 26 and 27: Action plan Rationale Responsible a
- Page 28 and 29: To address the premature deaths cau
- Page 30 and 31: Implementation approach Implementat
- Page 32 and 33: 3. Brief description of Northeast I
- Page 34 and 35: Arunachal Pradesh Arunachal Pradesh
- Page 36 and 37: Meghalaya Meghalaya, literally mean
- Page 38 and 39: Nagaland Nagaland is located on the
- Page 40 and 41: Sikkim Sikkim, enveloped by the Him
- Page 42 and 43: as in the national economy. Assam
- Page 44 and 45: 3.3.5 Tripura In rupee terms, gross
- Page 46 and 47: 3.3.9 Comparison of per capita inco
- Page 49 and 50: 4. Oil & gas sector outlook in Nort
- Page 51 and 52: 4.2 Hydrocarbon resources The progn
- Page 53 and 54: Table 24: Status of PML of nominati
- Page 55 and 56: Block NELP Work carried out 2D (GLK
- Page 57 and 58: The table below summarises hydrocar
- Page 59 and 60: 4.4.2 Midstream The midstream secto
- Page 61 and 62: 5. Upstream
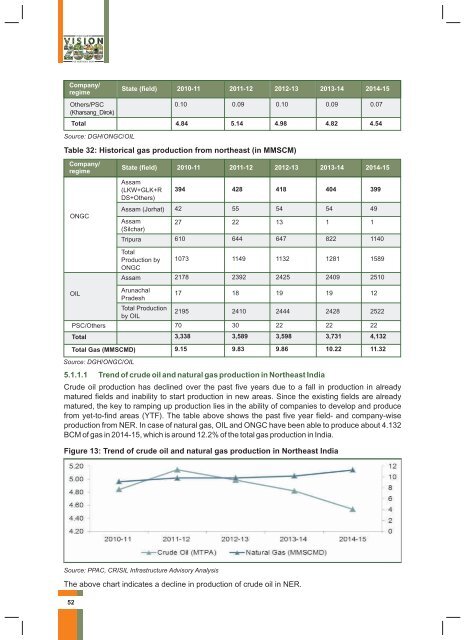
- Page 63: 5. Upstream 5.1 Crude oil & natural
- Page 67 and 68: Table 34: Production forecast for c
- Page 69 and 70: Table 36: Production forecast for n
- Page 71 and 72: 5.1.4 Action areas for upstream sec
- Page 73 and 74: A management committee with represe
- Page 75 and 76: 5.1.4.1.1 Action area The table bel
- Page 77 and 78: Case Study- Nigeria Prior to 1993,
- Page 79 and 80: The survey area mainly comprises of
- Page 81 and 82: 5.1.4.2.1 Action plan The table bel
- Page 83 and 84: The salient features of the State G
- Page 85 and 86: 5.1.4.3.4 Status of blocks ONGC acq
- Page 87 and 88: 5.1.4.4.2 Capital cost After the ex
- Page 89 and 90: 5.1.4.4.4 Key issues/ concerns The
- Page 91 and 92: Similarly, list of challenging bloc
- Page 93 and 94: also imported. Indian service provi
- Page 95 and 96: Jorhat/Dibrugarh seem to be an idea
- Page 97 and 98: scenario in the years to come. It w
- Page 99 and 100: Areas in which PEL-PML grants are a
- Page 101 and 102: Similarly, ONGC has provided a list
- Page 103 and 104: 5.1.4.7.2 Action plan The table bel
- Page 105: The agency to facilitate the partic
- Page 108 and 109: 6. Midstream In India, crude oil an
- Page 110 and 111: 6.2 Natural gas pipeline network in
- Page 112 and 113: Table 62: Existing product and LPG
- Page 114 and 115:
supply and consumption points. One
- Page 116 and 117:
closer to gas sources devour the be
- Page 118 and 119:
The figure below is a geographical
- Page 120 and 121:
Figure 33: Map of pipelines conside
- Page 122 and 123:
6.6 Action plan The action plan for
- Page 124 and 125:
Action items Concerned authorities
- Page 126 and 127:
Energy highway will pass through Tr
- Page 128 and 129:
Table 72: Pipeline routes having co
- Page 130 and 131:
Hon’ble MoS (I/C), Petroleum and
- Page 132 and 133:
7. Downstream infrastructure 7.1 Re
- Page 134 and 135:
However, by 2030, crude oil supply
- Page 136 and 137:
7.2.2 Existing supply and consumpti
- Page 138 and 139:
Figure 39: Demand estimation for PO
- Page 140 and 141:
7.2.3.5 Forecasting overall demand
- Page 142 and 143:
Table 82: Demand in TMTPA for POL p
- Page 144 and 145:
Table 88: Demand in TMTPA for POL p
- Page 146 and 147:
Deficit of bitumen in NER From the
- Page 148 and 149:
Currently, across the globe, ethano
- Page 150 and 151:
Government Schemes to Support Bambo
- Page 152 and 153:
Gopanari LPG Bottling Plant LPG bot
- Page 154 and 155:
State New Location Product Tankage
- Page 156 and 157:
7.2.6.3 Expansion projects of LPG s
- Page 158 and 159:
Lower volatility in gas prices vis-
- Page 160 and 161:
7.3.2.5 Gas demand from industrial
- Page 162 and 163:
7.4 Key issues/ concerns 7.4.1 Refi
- Page 164 and 165:
7.4.2 Natural gas The key issues ar
- Page 166 and 167:
7.5.1.3 Refining margins VAT and en
- Page 168 and 169:
Strategies for logistics and transp
- Page 170 and 171:
Bangladesh for movement of heavy ma
- Page 172 and 173:
Table 118: Production forecast of n
- Page 174 and 175:
7.5.2.6 Development of common user
- Page 176 and 177:
Cascading of gas Connecting the fla
- Page 178 and 179:
7.5.3.2 Substitute LPG with natural
- Page 180 and 181:
Hon’ble Prime Minister of India S
- Page 182 and 183:
7.6 Action Plan Table 124: Action p
- Page 184 and 185:
Action items Authorities concerned
- Page 186 and 187:
Action items Bio-ethanol Authoritie
- Page 189 and 190:
8. Skill development 8.1 Background
- Page 191 and 192:
8.3 Team composition for E&P activi
- Page 193 and 194:
8.4 Course-wise detail We have anal
- Page 195 and 196:
Table 133: List of courses for ITI
- Page 197 and 198:
Table 136: List of courses for ITI
- Page 199 and 200:
The ratio of requirement of executi
- Page 201 and 202:
This initiative can prove highly be
- Page 203 and 204:
9. Infrastructure gaps Infrastructu
- Page 205 and 206:
Improvement of existing single-lane
- Page 207 and 208:
Action items Authority concerned Sh
- Page 209 and 210:
10. Law and order The following act
- Page 211 and 212:
11. Trade opportunity with neighbou
- Page 213 and 214:
Table 146: Petroleum product import
- Page 215 and 216:
11.6 Trade opportunity 11.6.1 Petro
- Page 217 and 218:
12.2.3 Midstream There is a proposa
- Page 219:
Action items Authorities concerned
- Page 222 and 223:
13. Health/medical services Nationa
- Page 224 and 225:
14. Corporate Social Responsibility
- Page 226 and 227:
In an effort to preserve the histor
- Page 229 and 230:
15. Immediate Term Initiatives The
- Page 231 and 232:
15.2.3 Increasing LPG & POL product
- Page 233 and 234:
15.2.5 Developing northeast as a wa
- Page 235 and 236:
16. Hydrocarbon Vision 2030 for NER
- Page 237 and 238:
17. Vision 2030 - Key initiatives p
- Page 239:
17.6 Nagaland Production of oil & g
- Page 242 and 243:
18. Appendix 18.1 Power transmissio
- Page 244 and 245:
Only about one-third of the stretch
- Page 246 and 247:
Annexure I: Abbreviation Acronym AA
- Page 248 and 249:
Acronym NOC NPNG NRL NSDC NSDP OALP
- Page 250 and 251:
Annexure III: Tax structure in exis
- Page 252 and 253:
Annexure V: OTPC power plant, Tripu
- Page 254 and 255:
Annexure VII: Kharsang block Kharsa
- Page 256 and 257:
Annexure VIII: Major projects/schem
- Page 258 and 259:
The hilly states are an attractive
- Page 260 and 261:
Annexure X: Details of oil & gas re
- Page 262 and 263:
Annexure XII: Details of blocks wit
- Page 264 and 265:
Blocks of ONGC in which PEL and PML
- Page 266 and 267:
Annexure XIII: Capital Investment b
- Page 268:
Annexure XV: Expected tankage and c