Hydrocarbon Vision 2030 (ஹைட்ரோகார்பன் தொலைநோக்கு ஆவணம் 2030)

You also want an ePaper? Increase the reach of your titles
YUMPU automatically turns print PDFs into web optimized ePapers that Google loves.
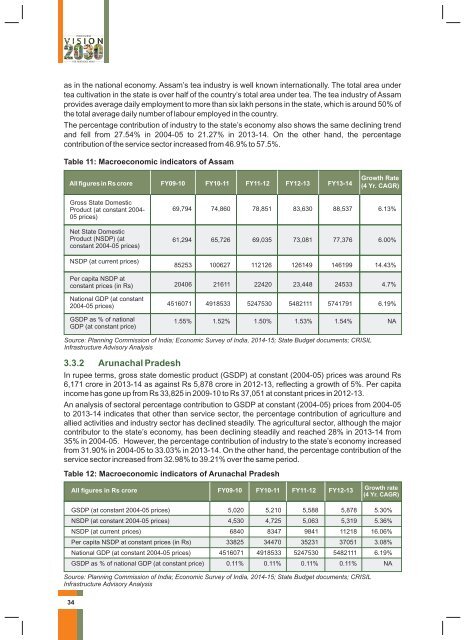
as in the national economy. Assam’s tea industry is well known internationally. The total area under<br />
tea cultivation in the state is over half of the country’s total area under tea. The tea industry of Assam<br />
provides average daily employment to more than six lakh persons in the state, which is around 50% of<br />
the total average daily number of labour employed in the country.<br />
The percentage contribution of industry to the state’s economy also shows the same declining trend<br />
and fell from 27.54% in 2004-05 to 21.27% in 2013-14. On the other hand, the percentage<br />
contribution of the service sector increased from 46.9% to 57.5%.<br />
Table 11: Macroeconomic indicators of Assam<br />
All figures in Rs crore FY09-10 FY10-11 FY11-12 FY12-13 FY13-14<br />
Growth Rate<br />
(4 Yr. CAGR)<br />
Gross State Domestic<br />
Product (at constant 2004-<br />
05 prices)<br />
Net State Domestic<br />
Product (NSDP) (at<br />
constant 2004-05 prices)<br />
NSDP (at current prices)<br />
Per capita NSDP at<br />
constant prices (in Rs)<br />
National GDP (at constant<br />
2004-05 prices)<br />
GSDP as % of national<br />
GDP (at constant price)<br />
69,794 74,860 78,851 83,630 88,537 6.13%<br />
61,294 65,726 69,035 73,081 77,376 6.00%<br />
85253 100627 112126 126149 146199 14.43%<br />
20406 21611 22420 23,448 24533 4.7%<br />
4516071 4918533 5247530 5482111 5741791 6.19%<br />
1.55% 1.52% 1.50% 1.53% 1.54% NA<br />
Source: Planning Commission of India; Economic Survey of India, 2014-15; State Budget documents; CRISIL<br />
Infrastructure Advisory Analysis<br />
3.3.2 Arunachal Pradesh<br />
In rupee terms, gross state domestic product (GSDP) at constant (2004-05) prices was around Rs<br />
6,171 crore in 2013-14 as against Rs 5,878 crore in 2012-13, reflecting a growth of 5%. Per capita<br />
income has gone up from Rs 33,825 in 2009-10 to Rs 37,051 at constant prices in 2012-13.<br />
An analysis of sectoral percentage contribution to GSDP at constant (2004-05) prices from 2004-05<br />
to 2013-14 indicates that other than service sector, the percentage contribution of agriculture and<br />
allied activities and industry sector has declined steadily. The agricultural sector, although the major<br />
contributor to the state’s economy, has been declining steadily and reached 28% in 2013-14 from<br />
35% in 2004-05. However, the percentage contribution of industry to the state’s economy increased<br />
from 31.90% in 2004-05 to 33.03% in 2013-14. On the other hand, the percentage contribution of the<br />
service sector increased from 32.98% to 39.21% over the same period.<br />
Table 12: Macroeconomic indicators of Arunachal Pradesh<br />
All figures in Rs crore FY09-10 FY10-11 FY11-12 FY12-13<br />
Growth rate<br />
(4 Yr. CAGR)<br />
GSDP (at constant 2004-05 prices)<br />
5,020 5,210 5,588 5,878 5.30%<br />
NSDP (at constant 2004-05 prices) 4,530 4,725 5,063 5,319 5.36%<br />
NSDP (at current prices) 6840 8347 9841 11218 16.06%<br />
Per capita NSDP at constant prices (in Rs) 33825 34470 35231 37051 3.08%<br />
National GDP (at constant 2004-05 prices) 4516071 4918533 5247530 5482111 6.19%<br />
GSDP as % of national GDP (at constant price) 0.11% 0.11% 0.11% 0.11% NA<br />
Source: Planning Commission of India; Economic Survey of India, 2014-15; State Budget documents; CRISIL<br />
Infrastructure Advisory Analysis<br />
34