Hydrocarbon Vision 2030 (ஹைட்ரோகார்பன் தொலைநோக்கு ஆவணம் 2030)

You also want an ePaper? Increase the reach of your titles
YUMPU automatically turns print PDFs into web optimized ePapers that Google loves.
3.3.3 Manipur<br />
In rupee terms, gross state domestic product (GSDP) at constant (2004-05) prices was around Rs<br />
7,892 crore in 2012-13 as against Rs 7,231 crore in 2011-12, reflecting a growth of 9%. Per capita<br />
income has gone up from Rs 22,197 in 2009-10 to Rs 23,996 at constant prices in 2012-13.<br />
An analysis of sectoral percentage contribution to GSDP at constant (2004-05) prices from 2004-05<br />
to 2012-13 indicates that the percentage contribution of agriculture and allied activities and industry<br />
sector has declined steadily. The agricultural sector, although the major contributor to the state’s<br />
economy, has been declining steadily and reached 18% in 2012-13 from 25% in 2004-05. However,<br />
the percentage contribution of industry to the state’s economy has declined from 36% in 2004-05 to<br />
27% in 2013-14. The percentage contribution of the service sector has increased from 39% to 54%<br />
over the same period of time.<br />
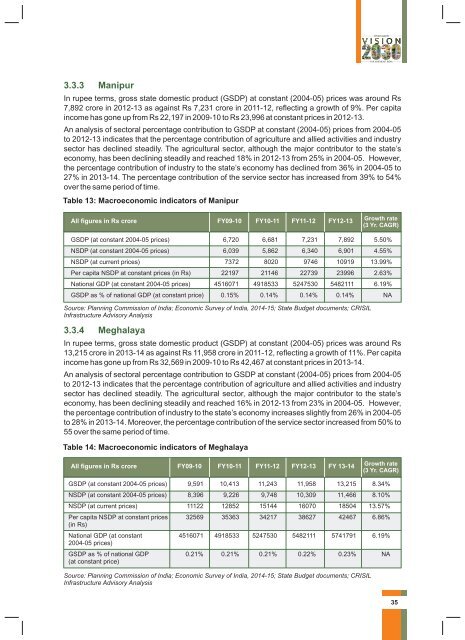
Table 13: Macroeconomic indicators of Manipur<br />
All figures in Rs crore FY09-10 FY10-11 FY11-12 FY12-13<br />
Growth rate<br />
(3 Yr. CAGR)<br />
GSDP (at constant 2004-05 prices) 6,720 6,681 7,231 7,892 5.50%<br />
NSDP (at constant 2004-05 prices) 6,039 5,862 6,340 6,901 4.55%<br />
NSDP (at current prices) 7372 8020 9746 10919 13.99%<br />
Per capita NSDP at constant prices (in Rs) 22197 21146 22739 23996 2.63%<br />
National GDP (at constant 2004-05 prices) 4516071 4918533 5247530 5482111 6.19%<br />
GSDP as % of national GDP (at constant price) 0.15% 0.14% 0.14% 0.14% NA<br />
Source: Planning Commission of India; Economic Survey of India, 2014-15; State Budget documents; CRISIL<br />
Infrastructure Advisory Analysis<br />
3.3.4 Meghalaya<br />
In rupee terms, gross state domestic product (GSDP) at constant (2004-05) prices was around Rs<br />
13,215 crore in 2013-14 as against Rs 11,958 crore in 2011-12, reflecting a growth of 11%. Per capita<br />
income has gone up from Rs 32,569 in 2009-10 to Rs 42,467 at constant prices in 2013-14.<br />
An analysis of sectoral percentage contribution to GSDP at constant (2004-05) prices from 2004-05<br />
to 2012-13 indicates that the percentage contribution of agriculture and allied activities and industry<br />
sector has declined steadily. The agricultural sector, although the major contributor to the state’s<br />
economy, has been declining steadily and reached 16% in 2012-13 from 23% in 2004-05. However,<br />
the percentage contribution of industry to the state’s economy increases slightly from 26% in 2004-05<br />
to 28% in 2013-14. Moreover, the percentage contribution of the service sector increased from 50% to<br />
55 over the same period of time.<br />
Table 14: Macroeconomic indicators of Meghalaya<br />
All figures in Rs crore FY09-10 FY10-11 FY11-12 FY12-13 FY 13-14<br />
Growth rate<br />
(3 Yr. CAGR)<br />
GSDP (at constant 2004-05 prices) 9,591 10,413 11,243 11,958 13,215 8.34%<br />
NSDP (at constant 2004-05 prices) 8,396 9,226 9,748 10,309 11,466 8.10%<br />
NSDP (at current prices) 11122 12852 15144 16070 18504 13.57%<br />
Per capita NSDP at constant prices 32569 35363 34217 38627 42467 6.86%<br />
(in Rs)<br />
National GDP (at constant 4516071 4918533 5247530 5482111 5741791 6.19%<br />
2004-05 prices)<br />
GSDP as % of national GDP 0.21% 0.21% 0.21% 0.22% 0.23% NA<br />
(at constant price)<br />
Source: Planning Commission of India; Economic Survey of India, 2014-15; State Budget documents; CRISIL<br />
Infrastructure Advisory Analysis<br />
35