The 3Dimensional Trading Breakthrough

You also want an ePaper? Increase the reach of your titles
YUMPU automatically turns print PDFs into web optimized ePapers that Google loves.
<strong>The</strong> 3 Dimensional <strong>Trading</strong> <strong>Breakthrough</strong><br />
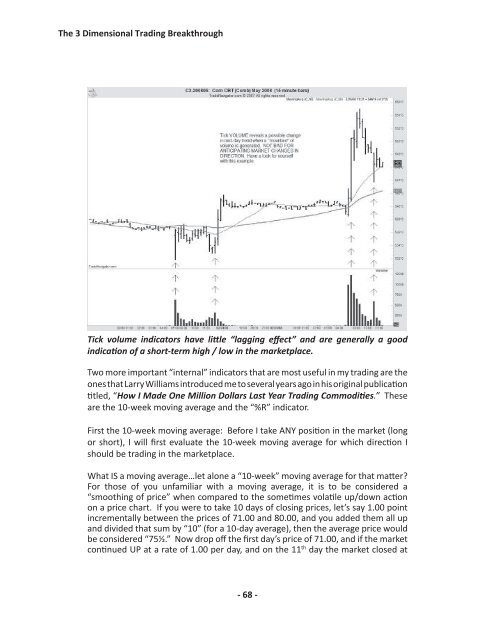
Tick volume indicators have little “lagging effect” and are generally a good<br />
indication of a short-term high / low in the marketplace.<br />
Two more important “internal” indicators that are most useful in my trading are the<br />
ones that Larry Williams introduced me to several years ago in his original publication<br />
titled, “How I Made One Million Dollars Last Year <strong>Trading</strong> Commodities.” <strong>The</strong>se<br />
are the 10-week moving average and the “%R” indicator.<br />
First the 10-week moving average: Before I take ANY position in the market (long<br />
or short), I will first evaluate the 10-week moving average for which direction I<br />
should be trading in the marketplace.<br />
What IS a moving average…let alone a “10-week” moving average for that matter?<br />
For those of you unfamiliar with a moving average, it is to be considered a<br />
“smoothing of price” when compared to the sometimes volatile up/down action<br />
on a price chart. If you were to take 10 days of closing prices, let’s say 1.00 point<br />
incrementally between the prices of 71.00 and 80.00, and you added them all up<br />
and divided that sum by “10” (for a 10-day average), then the average price would<br />
be considered “75½.” Now drop off the first day’s price of 71.00, and if the market<br />
continued UP at a rate of 1.00 per day, and on the 11 th day the market closed at<br />
- 68 -