The 3Dimensional Trading Breakthrough

Create successful ePaper yourself
Turn your PDF publications into a flip-book with our unique Google optimized e-Paper software.
<strong>The</strong> 3 Dimensional <strong>Trading</strong> <strong>Breakthrough</strong><br />
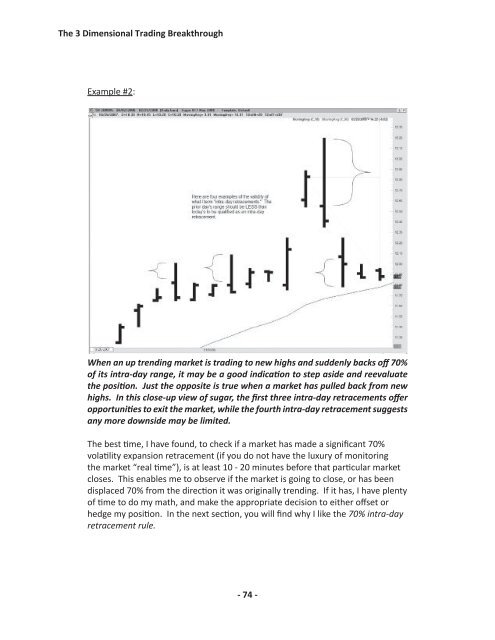
Example #2:<br />
When an up trending market is trading to new highs and suddenly backs off 70%<br />
of its intra-day range, it may be a good indication to step aside and reevaluate<br />
the position. Just the opposite is true when a market has pulled back from new<br />
highs. In this close-up view of sugar, the first three intra-day retracements offer<br />
opportunities to exit the market, while the fourth intra-day retracement suggests<br />
any more downside may be limited.<br />
<strong>The</strong> best time, I have found, to check if a market has made a significant 70%<br />
volatility expansion retracement (if you do not have the luxury of monitoring<br />
the market “real time”), is at least 10 - 20 minutes before that particular market<br />
closes. This enables me to observe if the market is going to close, or has been<br />
displaced 70% from the direction it was originally trending. If it has, I have plenty<br />
of time to do my math, and make the appropriate decision to either offset or<br />
hedge my position. In the next section, you will find why I like the 70% intra-day<br />
retracement rule.<br />
- 74 -