The 3Dimensional Trading Breakthrough
You also want an ePaper? Increase the reach of your titles
YUMPU automatically turns print PDFs into web optimized ePapers that Google loves.
Brian Schad<br />
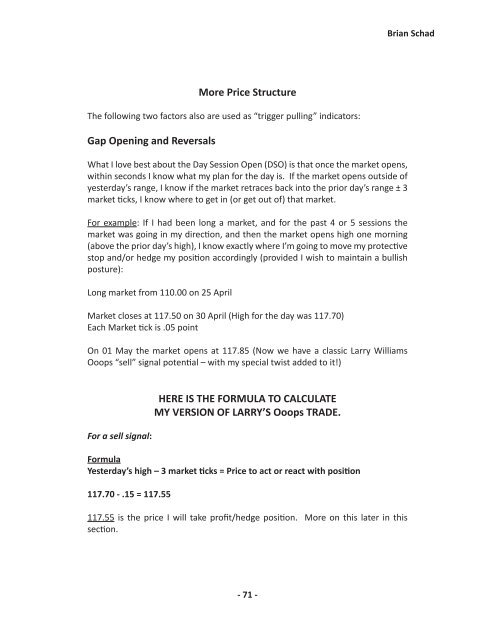
More Price Structure<br />
<strong>The</strong> following two factors also are used as “trigger pulling” indicators:<br />
Gap Opening and Reversals<br />
What I love best about the Day Session Open (DSO) is that once the market opens,<br />
within seconds I know what my plan for the day is. If the market opens outside of<br />
yesterday’s range, I know if the market retraces back into the prior day’s range ± 3<br />
market ticks, I know where to get in (or get out of) that market.<br />
For example: If I had been long a market, and for the past 4 or 5 sessions the<br />
market was going in my direction, and then the market opens high one morning<br />
(above the prior day’s high), I know exactly where I’m going to move my protective<br />
stop and/or hedge my position accordingly (provided I wish to maintain a bullish<br />
posture):<br />
Long market from 110.00 on 25 April<br />
Market closes at 117.50 on 30 April (High for the day was 117.70)<br />
Each Market tick is .05 point<br />
On 01 May the market opens at 117.85 (Now we have a classic Larry Williams<br />
Ooops “sell” signal potential – with my special twist added to it!)<br />
For a sell signal:<br />
HERE IS THE FORMULA TO CALCULATE<br />
MY VERSION OF LARRY’S Ooops TRADE.<br />
Formula<br />
Yesterday’s high – 3 market ticks = Price to act or react with position<br />
117.70 - .15 = 117.55<br />
117.55 is the price I will take profit/hedge position. More on this later in this<br />
section.<br />
- 71 -


