IRAC Instrument Handbook - IRSA - California Institute of Technology
IRAC Instrument Handbook - IRSA - California Institute of Technology
IRAC Instrument Handbook - IRSA - California Institute of Technology

Create successful ePaper yourself
Turn your PDF publications into a flip-book with our unique Google optimized e-Paper software.
<strong>IRAC</strong> <strong>Instrument</strong> <strong>Handbook</strong><br />
coefficients that are in the world coordinate system <strong>of</strong> each image. The main effect is that the PSF and<br />
distortion may be slightly color-dependent, which may be detectable for sources with extreme color<br />
variations across the <strong>IRAC</strong> bands.<br />
A much larger variation in the flux <strong>of</strong> sources measured in different parts <strong>of</strong> the array is due to the tilt <strong>of</strong><br />
the filters, which leads to a different spectral response in different parts <strong>of</strong> the field <strong>of</strong> view. The flat field<br />
calibration is done with the zodiacal light, which is relatively red; blue sources have a flux variation <strong>of</strong> up<br />
to 10% from one side <strong>of</strong> an array to the other (see Section 4.5 in this <strong>Handbook</strong> for more details).<br />
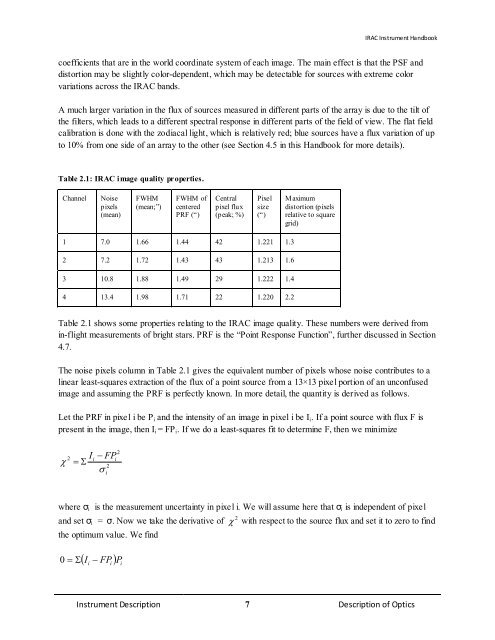
Table 2.1: <strong>IRAC</strong> image quality properties.<br />
Channel Noise<br />
pixels<br />
(mean)<br />
FWHM<br />
(mean;”)<br />
FWHM <strong>of</strong><br />
centered<br />
PRF (“)<br />
Central<br />
pixel flux<br />
(peak; %)<br />
<strong>Instrument</strong> Description 7 Description <strong>of</strong> Optics<br />
Pixel<br />
size<br />
(“)<br />
1 7.0 1.66 1.44 42 1.221 1.3<br />
2 7.2 1.72 1.43 43 1.213 1.6<br />
3 10.8 1.88 1.49 29 1.222 1.4<br />
4 13.4 1.98 1.71 22 1.220 2.2<br />
Maximum<br />
distortion (pixels<br />
relative to square<br />
grid)<br />
Table 2.1 shows some properties relating to the <strong>IRAC</strong> image quality. These numbers were derived from<br />
in-flight measurements <strong>of</strong> bright stars. PRF is the “Point Response Function”, further discussed in Section<br />
4.7.<br />
The noise pixels column in Table 2.1 gives the equivalent number <strong>of</strong> pixels whose noise contributes to a<br />
linear least-squares extraction <strong>of</strong> the flux <strong>of</strong> a point source from a 13×13 pixel portion <strong>of</strong> an unconfused<br />
image and assuming the PRF is perfectly known. In more detail, the quantity is derived as follows.<br />
Let the PRF in pixel i be Pi and the intensity <strong>of</strong> an image in pixel i be Ii. If a point source with flux F is<br />
present in the image, then Ii = FPi. If we do a least-squares fit to determine F, then we minimize<br />
2 i FP I −<br />
χ = Σ<br />
σ<br />
2<br />
i<br />
2<br />
i<br />
where σi is the measurement uncertainty in pixel i. We will assume here that σi is independent <strong>of</strong> pixel<br />
2<br />
and set σi = σ. Now we take the derivative <strong>of</strong> χ with respect to the source flux and set it to zero to find<br />
the optimum value. We find<br />
0<br />
= Σ<br />
( Ii − FPi<br />
) Pi