IRAC Instrument Handbook - IRSA - California Institute of Technology
IRAC Instrument Handbook - IRSA - California Institute of Technology
IRAC Instrument Handbook - IRSA - California Institute of Technology

You also want an ePaper? Increase the reach of your titles
YUMPU automatically turns print PDFs into web optimized ePapers that Google loves.
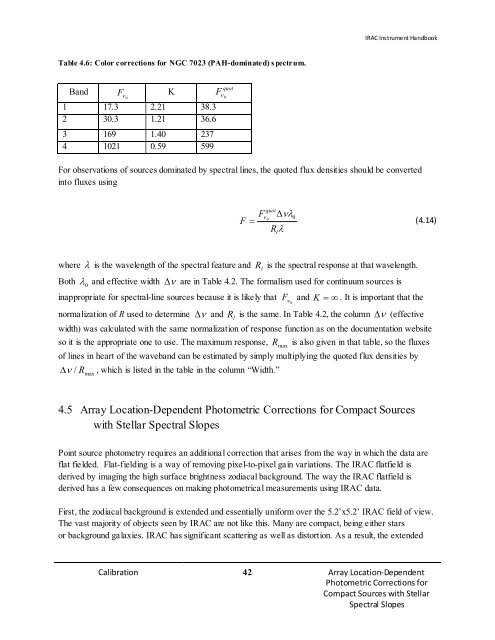
Table 4.6: Color corrections for NGC 7023 (PAH-dominated) s pectrum.<br />
Band<br />
F K<br />
ν 0<br />
1 17.3 2.21 38.3<br />
2 30.3 1.21 36.6<br />
3 169 1.40 237<br />
4 1021 0.59 599<br />
quot<br />
Fν 0<br />
<strong>IRAC</strong> <strong>Instrument</strong> <strong>Handbook</strong><br />
For observations <strong>of</strong> sources dominated by spectral lines, the quoted flux densities should be converted<br />
into fluxes using<br />
quot<br />
Fν<br />
νλ<br />
0 0<br />
F<br />
R λ<br />
∆<br />
= (4.14)<br />
where λ is the wavelength <strong>of</strong> the spectral feature and R l is the spectral response at that wavelength.<br />
Both λ 0 and effective width ∆ ν are in Table 4.2. The formalism used for continuum sources is<br />
inappropriate for spectral-line sources because it is likely that<br />
Calibration 42 Array Location-Dependent<br />
Photometric Corrections for<br />
Compact Sources with Stellar<br />
Spectral Slopes<br />
l<br />
F and K = ∞ . It is important that the<br />
normalization <strong>of</strong> R used to determine ∆ ν and R l is the same. In Table 4.2, the column ∆ ν (effective<br />
width) was calculated with the same normalization <strong>of</strong> response function as on the documentation website<br />
so it is the appropriate one to use. The maximum response, R max is also given in that table, so the fluxes<br />
<strong>of</strong> lines in heart <strong>of</strong> the waveband can be estimated by simply multiplying the quoted flux densities by<br />
∆ ν / R , which is listed in the table in the column “Width.”<br />
max<br />
4.5 Array Location-Dependent Photometric Corrections for Compact Sources<br />
with Stellar Spectral Slopes<br />
Point source photometry requires an additional correction that arises from the way in which the data are<br />
flat fie lded. Flat-fielding is a way <strong>of</strong> removing pixe l-to-pixel gain variations. The <strong>IRAC</strong> flatfie ld is<br />
derived by imaging the high surface brightness zodiacal background. The way the <strong>IRAC</strong> flatfield is<br />
derived has a few consequences on making photometrical measurements using <strong>IRAC</strong> data.<br />
First, the zodiacal background is extended and essentially uniform over the 5.2’x5.2’ <strong>IRAC</strong> field <strong>of</strong> view.<br />
The vast majority <strong>of</strong> objects seen by <strong>IRAC</strong> are not like this. Many are compact, being either stars<br />
or background galaxies. <strong>IRAC</strong> has significant scattering as well as distortion. As a result, the extended<br />
ν 0