IRAC Instrument Handbook - IRSA - California Institute of Technology
IRAC Instrument Handbook - IRSA - California Institute of Technology
IRAC Instrument Handbook - IRSA - California Institute of Technology
Create successful ePaper yourself
Turn your PDF publications into a flip-book with our unique Google optimized e-Paper software.
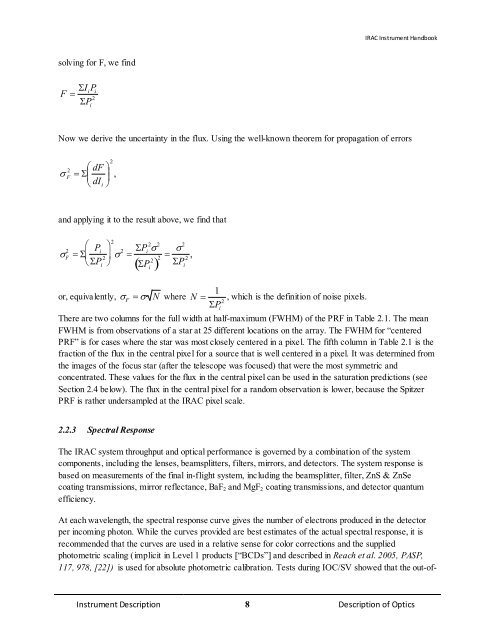
solving for F, we find<br />
ΣI<br />
P<br />
F =<br />
ΣP<br />
i i<br />
2<br />
i<br />
<strong>IRAC</strong> <strong>Instrument</strong> <strong>Handbook</strong><br />
Now we derive the uncertainty in the flux. Using the well-known theorem for propagation <strong>of</strong> errors<br />
2 ⎛ dF ⎞<br />
σ ⎜<br />
⎟<br />
F = Σ ,<br />
⎝ dIi<br />
⎠<br />
2<br />
and applying it to the result above, we find that<br />
σ F<br />
⎛<br />
2 Pi = Σ⎜ ⎝<br />
2<br />
ΣPi ⎞<br />
⎟<br />
⎠<br />
2<br />
σ 2 = ΣP 2 2<br />
i σ σ2<br />
2<br />
2 = 2<br />
ΣP ΣP<br />
i<br />
i<br />
,<br />
( )<br />
1<br />
or, equivalently, σF = σ N where N = , which is the definition <strong>of</strong> noise pixels.<br />
2<br />
ΣPi<br />
There are two columns for the full width at half-maximum (FWHM) <strong>of</strong> the PRF in Table 2.1. The mean<br />
FWHM is from observations <strong>of</strong> a star at 25 different locations on the array. The FWHM for “centered<br />
PRF” is for cases where the star was most closely centered in a pixel. The fifth column in Table 2.1 is the<br />
fraction <strong>of</strong> the flux in the central pixel for a source that is well centered in a pixel. It was determined from<br />
the images <strong>of</strong> the focus star (after the telescope was focused) that were the most symmetric and<br />
concentrated. These values for the flux in the central pixel can be used in the saturation predictions (see<br />
Section 2.4 below). The flux in the central pixel for a random observation is lower, because the Spitzer<br />
PRF is rather undersampled at the <strong>IRAC</strong> pixel scale.<br />
2.2.3 Spectral Response<br />
The <strong>IRAC</strong> system throughput and optical performance is governed by a combination <strong>of</strong> the system<br />
components, including the lenses, beamsplitters, filters, mirrors, and detectors. The system response is<br />
based on measurements <strong>of</strong> the final in-flight system, including the beamsplitter, filter, ZnS & ZnSe<br />
coating transmissions, mirror reflectance, BaF2 and MgF2 coating transmissions, and detector quantum<br />
efficiency.<br />
At each wavelength, the spectral response curve gives the number <strong>of</strong> electrons produced in the detector<br />
per incoming photon. While the curves provided are best estimates <strong>of</strong> the actual spectral response, it is<br />
recommended that the curves are used in a relative sense for color corrections and the supplied<br />
photometric scaling (implicit in Level 1 products [“BCDs”] and described in Reach et al. 2005, PASP,<br />
117, 978, [22]) is used for absolute photometric calibration. Tests during IOC/SV showed that the out-<strong>of</strong>-<br />
<strong>Instrument</strong> Description 8 Description <strong>of</strong> Optics


