IRAC Instrument Handbook - IRSA - California Institute of Technology
IRAC Instrument Handbook - IRSA - California Institute of Technology
IRAC Instrument Handbook - IRSA - California Institute of Technology

Create successful ePaper yourself
Turn your PDF publications into a flip-book with our unique Google optimized e-Paper software.
<strong>IRAC</strong> <strong>Instrument</strong> <strong>Handbook</strong><br />
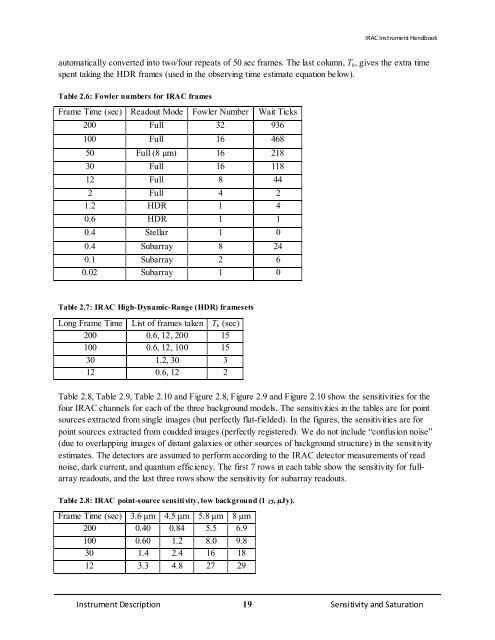
automatically converted into two/four repeats <strong>of</strong> 50 sec frames. The last column, Th, gives the extra time<br />
spent taking the HDR frames (used in the observing time estimate equation below).<br />
Table 2.6: Fowler numbers for <strong>IRAC</strong> frames<br />
Frame Time (sec) Readout Mode Fowler Number Wait Ticks<br />
200 Full 32 936<br />
100 Full 16 468<br />
50 Full (8 µm) 16 218<br />
30 Full 16 118<br />
12 Full 8 44<br />
2 Full 4 2<br />
1.2 HDR 1 4<br />
0.6 HDR 1 1<br />
0.4 Stellar 1 0<br />
0.4 Subarray 8 24<br />
0.1 Subarray 2 6<br />
0.02 Subarray 1 0<br />
Table 2.7: <strong>IRAC</strong> High-Dynamic-Range (HDR) framesets<br />
Long Frame Time List <strong>of</strong> frames taken Th (sec)<br />
200 0.6, 12, 200 15<br />
100 0.6, 12, 100 15<br />
30 1.2, 30 3<br />
12 0.6, 12 2<br />
Table 2.8, Table 2.9, Table 2.10 and Figure 2.8, Figure 2.9 and Figure 2.10 show the sensitivities for the<br />
four <strong>IRAC</strong> channels for each <strong>of</strong> the three background models. The sensitivities in the tables are for point<br />
sources extracted from single images (but perfectly flat-fielded). In the figures, the sensitivities are for<br />
point sources extracted from coadded images (perfectly registered). We do not include “confusion noise”<br />
(due to overlapping images <strong>of</strong> distant galaxies or other sources <strong>of</strong> background structure) in the sensitivity<br />
estimates. The detectors are assumed to perform according to the <strong>IRAC</strong> detector measurements <strong>of</strong> read<br />
noise, dark current, and quantum efficiency. The first 7 rows in each table show the sensitivity for fullarray<br />
readouts, and the last three rows show the sensitivity for subarray readouts.<br />
Table 2.8: <strong>IRAC</strong> point-source sensitivity, low background (1 σ, µJy).<br />
Frame Time (sec) 3.6 µm 4.5 µm 5.8 µm 8 µm<br />
200 0.40 0.84 5.5 6.9<br />
100 0.60 1.2 8.0 9.8<br />
30 1.4 2.4 16 18<br />
12 3.3 4.8 27 29<br />
<strong>Instrument</strong> Description 19 Sensitivity and Saturation