IRAC Instrument Handbook - IRSA - California Institute of Technology
IRAC Instrument Handbook - IRSA - California Institute of Technology
IRAC Instrument Handbook - IRSA - California Institute of Technology

You also want an ePaper? Increase the reach of your titles
YUMPU automatically turns print PDFs into web optimized ePapers that Google loves.
<strong>IRAC</strong> <strong>Instrument</strong> <strong>Handbook</strong><br />
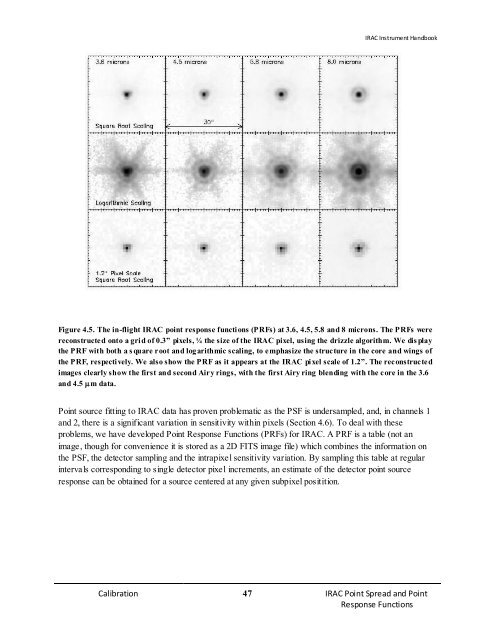
Figure 4.5. The in-flight <strong>IRAC</strong> point response functions (PRFs) at 3.6, 4.5, 5.8 and 8 microns. The PRFs were<br />
reconstructed onto a grid <strong>of</strong> 0.3” pixels, ¼ the size <strong>of</strong> the <strong>IRAC</strong> pixel, using the drizzle algorithm. We display<br />
the PRF with both a s quare root and logarithmic scaling, to emphasize the structure in the core and wings <strong>of</strong><br />
the PRF, respectively. We also show the PRF as it appears at the <strong>IRAC</strong> pixel scale <strong>of</strong> 1.2”. The reconstructed<br />
images clearly show the first and second Airy rings, with the first Airy ring blending with the core in the 3.6<br />
and 4.5 µm data.<br />
Point source fitting to <strong>IRAC</strong> data has proven problematic as the PSF is undersampled, and, in channels 1<br />
and 2, there is a significant variation in sensitivity within pixels (Section 4.6). To deal with these<br />
problems, we have developed Point Response Functions (PRFs) for <strong>IRAC</strong>. A PRF is a table (not an<br />
image, though for convenience it is stored as a 2D FITS image file) which combines the information on<br />
the PSF, the detector sampling and the intrapixel sensitivity variation. By sampling this table at regular<br />
intervals corresponding to single detector pixel increments, an estimate <strong>of</strong> the detector point source<br />
response can be obtained for a source centered at any given subpixel positition.<br />
Calibration 47 <strong>IRAC</strong> Point Spread and Point<br />
Response Functions