- Page 1 and 2: IRAC Instrument Handbook Spitzer He
- Page 3 and 4: iii IRAC Instrument Handbook 4.8 CA
- Page 5 and 6: v IRAC Instrument Handbook 8.1.4.5
- Page 7 and 8: IRAC Instrument Handbook Astronomic
- Page 9 and 10: 2 Instrument Description 2.1 Overvi
- Page 11 and 12: Pickoff Mirror IRAC Instrument Hand
- Page 13 and 14: solving for F, we find ΣI P F = Σ
- Page 15 and 16: IRAC Instrument Handbook Figure 2.5
- Page 17 and 18: Instrument Description 12 Detectors
- Page 19 and 20: Instrument Description 14 Electroni
- Page 21 and 22: IRAC Instrument Handbook into a red
- Page 23 and 24: f ex (throughput correction for bac
- Page 25: 2 32 38 150 92 0.6 a 180 210 630 25
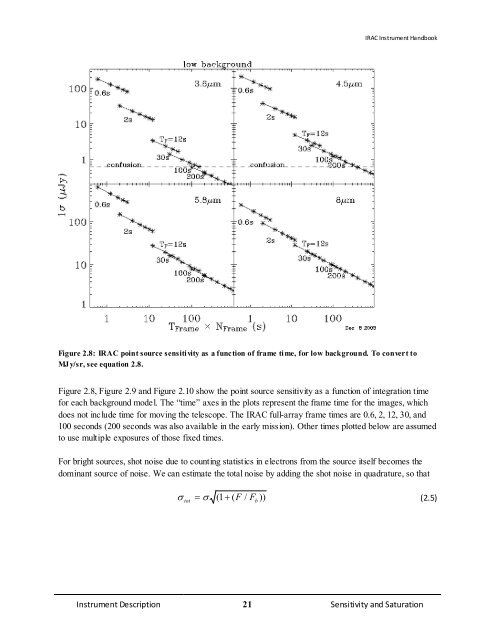
- Page 29 and 30: The noise pixels, Npix , are define
- Page 31 and 32: 3 Operating Modes IRAC Instrument H
- Page 33 and 34: IRAC Instrument Handbook spacing ha
- Page 35 and 36: Figure 3.1 : IRAC dither patterns f
- Page 37 and 38: Calibration 32 Flat Fields IRAC Ins
- Page 39 and 40: IRAC Instrument Handbook Figure 4.2
- Page 41 and 42: IRAC Instrument Handbook All of the
- Page 43 and 44: IRAC Instrument Handbook The calibr
- Page 45 and 46: IRAC Instrument Handbook the wavele
- Page 47 and 48: Table 4.6: Color corrections for NG
- Page 49 and 50: IRAC Instrument Handbook flux densi
- Page 51 and 52: IRAC Instrument Handbook Figure 4.4
- Page 53 and 54: 4.7.1 Core PRFs IRAC Instrument Han
- Page 55 and 56: IRAC Instrument Handbook Observatio
- Page 57 and 58: 4.9 Astrometry and Pixel Scales 4.9
- Page 59 and 60: IRAC Instrument Handbook photometry
- Page 61 and 62: IRAC Instrument Handbook document f
- Page 63 and 64: IRAC Instrument Handbook Figure 4.7
- Page 65 and 66: 5.8 µm 0.66−0.73 8.0 µm 0.74 IR
- Page 67 and 68: IRAC Instrument Handbook increased
- Page 69 and 70: IRAC Instrument Handbook Figure 4.1
- Page 71 and 72: IRAC Instrument Handbook with other
- Page 73 and 74: 5 Pipeline Processing 5.1 Level 1 (
- Page 75 and 76: IRAC Instrument Handbook Figure 5.1
- Page 77 and 78:
IRAC Instrument Handbook Figure 5.2
- Page 79 and 80:
IRAC Instrument Handbook part of th
- Page 81 and 82:
IRAC Instrument Handbook To obtain
- Page 83 and 84:
IRAC Instrument Handbook called “
- Page 85 and 86:
IRAC Instrument Handbook and should
- Page 87 and 88:
IRAC Instrument Handbook This is mo
- Page 89 and 90:
IRAC Instrument Handbook These skyd
- Page 91 and 92:
COMMENT 1 blank line BUNIT = 'MJy/s
- Page 93 and 94:
A_1_1 = 2.1886E-05 / distortion coe
- Page 95 and 96:
IRAC Instrument Handbook program is
- Page 97 and 98:
IRAC Instrument Handbook Again, the
- Page 99 and 100:
IRAC Instrument Handbook Figure 5.1
- Page 101 and 102:
IRAC Instrument Handbook estimate d
- Page 103 and 104:
IRAC Instrument Handbook Please not
- Page 105 and 106:
IRAC Instrument Handbook `even' EXP
- Page 107 and 108:
SPITZER_I2_6213376_0209_0000_1_cbcd
- Page 109 and 110:
IRAC Instrument Handbook with no li
- Page 111 and 112:
IRAC Instrument Handbook a suspect
- Page 113 and 114:
IRAC Instrument Handbook Figure 7.1
- Page 115 and 116:
7.2.2 Muxbleed (InSb) IRAC Instrume
- Page 117 and 118:
IRAC Instrument Handbook 4958976. N
- Page 119 and 120:
IRAC Instrument Handbook Figure 7.6
- Page 121 and 122:
7.2.8 Persistent Images IRAC Instru
- Page 123 and 124:
IRAC Instrument Handbook anneals. T
- Page 125 and 126:
7.3 Optical Artifacts 7.3.1 Stray L
- Page 127 and 128:
IRAC Instrument Handbook Example im
- Page 129 and 130:
IRAC Instrument Handbook Please not
- Page 131 and 132:
IRAC Instrument Handbook concentrat
- Page 133 and 134:
Figure 7.17: Pupil ghost in channel
- Page 135 and 136:
IRAC Instrument Handbook The "splot
- Page 137 and 138:
IRAC Instrument Handbook Figure 7.2
- Page 139 and 140:
8 Introduction to Data Analysis 8.1
- Page 141 and 142:
IRAC Instrument Handbook can be mor
- Page 143 and 144:
Appendix A. Pipeline History Log S1
- Page 145 and 146:
S18.0 Pipeline History Log 140 IRAC
- Page 147 and 148:
Pipeline History Log 142 IRAC Instr
- Page 149 and 150:
Pipeline History Log 144 IRAC Instr
- Page 151 and 152:
Pipeline History Log 146 IRAC Instr
- Page 153 and 154:
Pipeline History Log 148 IRAC Instr
- Page 155 and 156:
Performing Photometry on IRAC Image
- Page 157 and 158:
Performing Photometry on IRAC Image
- Page 159 and 160:
C.1 Use of the Five Times Oversampl
- Page 161 and 162:
Point Source Fitting IRAC Images wi
- Page 163 and 164:
Point Source Fitting IRAC Images wi
- Page 165 and 166:
Point Source Fitting IRAC Images wi
- Page 167 and 168:
Point Source Fitting IRAC Images wi
- Page 169 and 170:
Point Source Fitting IRAC Images wi
- Page 171 and 172:
Point Source Fitting IRAC Images wi
- Page 173 and 174:
IRAC BCD File Header 168 IRAC Instr
- Page 175 and 176:
IRAC BCD File Header 170 IRAC Instr
- Page 177 and 178:
IRAC BCD File Header 172 IRAC Instr
- Page 179 and 180:
DN Data Number. FET Field Effect Tr
- Page 181 and 182:
WCS World Coordinate System. Acrony
- Page 183 and 184:
Collaborators Construction and grou
- Page 185 and 186:
Margaret Drennan, Graduate Student
- Page 187 and 188:
Darron Harris, Mechanical Technicia
- Page 189 and 190:
Dick Bolt, Flight Assurance Jerry B
- Page 191 and 192:
Charles Stone, Harness Technician I
- Page 193 and 194:
Caltech (California Institute of Te
- Page 195 and 196:
List of Figures 190 IRAC Instrument
- Page 197 and 198:
List of Figures 192 IRAC Instrument
- Page 199 and 200:
List of Figures 194 IRAC Instrument
- Page 201 and 202:
Appendix I. Version Log Version 2.0
- Page 203 and 204:
Bibliography 198 IRAC Instrument Ha
- Page 205 and 206:
channel, 4, 6, 9, 24, 25, 26, 36, 4