IRAC Instrument Handbook - IRSA - California Institute of Technology
IRAC Instrument Handbook - IRSA - California Institute of Technology
IRAC Instrument Handbook - IRSA - California Institute of Technology

Create successful ePaper yourself
Turn your PDF publications into a flip-book with our unique Google optimized e-Paper software.
<strong>IRAC</strong> <strong>Instrument</strong> <strong>Handbook</strong><br />
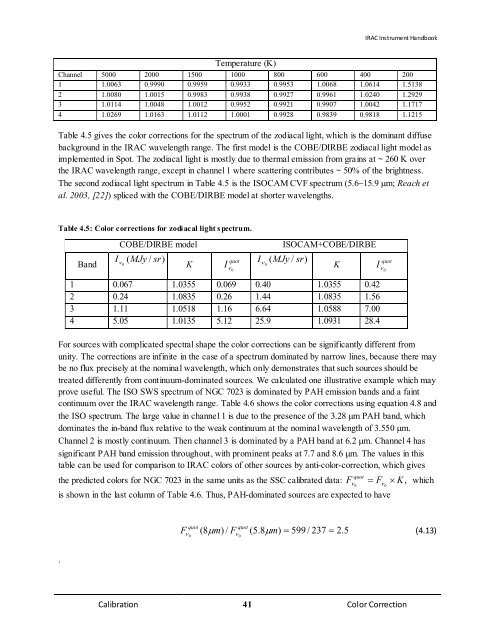
Temperature (K)<br />
Channel 5000 2000 1500 1000 800 600 400 200<br />
1 1.0063 0.9990 0.9959 0.9933 0.9953 1.0068 1.0614 1.5138<br />
2 1.0080 1.0015 0.9983 0.9938 0.9927 0.9961 1.0240 1.2929<br />
3 1.0114 1.0048 1.0012 0.9952 0.9921 0.9907 1.0042 1.1717<br />
4 1.0269 1.0163 1.0112 1.0001 0.9928 0.9839 0.9818 1.1215<br />
Table 4.5 gives the color corrections for the spectrum <strong>of</strong> the zodiacal light, which is the dominant diffuse<br />
background in the <strong>IRAC</strong> wavelength range. The first model is the COBE/DIRBE zodiacal light model as<br />
implemented in Spot. The zodiacal light is mostly due to thermal emission from grains at ~ 260 K over<br />
the <strong>IRAC</strong> wavelength range, except in channel 1 where scattering contributes ~ 50% <strong>of</strong> the brightness.<br />
The second zodiacal light spectrum in Table 4.5 is the ISOCAM CVF spectrum (5.6−15.9 µm; Reach et<br />
al. 2003, [22]) spliced with the COBE/DIRBE model at shorter wavelengths.<br />
Table 4.5: Color corrections for zodi acal light s pectrum.<br />
Band<br />
COBE/DIRBE model ISOCAM+COBE/DIRBE<br />
Iν ( MJy / sr)<br />
0<br />
K<br />
Iν ( MJy / sr)<br />
0<br />
K<br />
quot<br />
Iν 0<br />
1 0.067 1.0355 0.069 0.40 1.0355 0.42<br />
2 0.24 1.0835 0.26 1.44 1.0835 1.56<br />
3 1.11 1.0518 1.16 6.64 1.0588 7.00<br />
4 5.05 1.0135 5.12 25.9 1.0931 28.4<br />
For sources with complicated spectral shape the color corrections can be significantly different from<br />
unity. The corrections are infinite in the case <strong>of</strong> a spectrum dominated by narrow lines, because there may<br />
be no flux precisely at the nominal wavelength, which only demonstrates that such sources should be<br />
treated differently from continuum-dominated sources. We calculated one illustrative example which may<br />
prove useful. The ISO SWS spectrum <strong>of</strong> NGC 7023 is dominated by PAH emission bands and a faint<br />
continuum over the <strong>IRAC</strong> wavelength range. Table 4.6 shows the color corrections using equation 4.8 and<br />
the ISO spectrum. The large value in channel 1 is due to the presence <strong>of</strong> the 3.28 µm PAH band, which<br />
dominates the in-band flux relative to the weak continuum at the nominal wavelength <strong>of</strong> 3.550 µm.<br />
Channel 2 is mostly continuum. Then channel 3 is dominated by a PAH band at 6.2 µm. Channel 4 has<br />
significant PAH band emission throughout, with prominent peaks at 7.7 and 8.6 µm. The values in this<br />
table can be used for comparison to <strong>IRAC</strong> colors <strong>of</strong> other sources by anti-color-correction, which gives<br />
the predicted colors for NGC 7023 in the same units as the SSC calibrated data: F F K,<br />
0<br />
0<br />
quot<br />
ν = ν × which<br />
is shown in the last column <strong>of</strong> Table 4.6. Thus, PAH-dominated sources are expected to have<br />
.<br />
quot<br />
Iν 0<br />
quot<br />
quot<br />
Fν<br />
8µ<br />
m)<br />
/ Fν<br />
( 5.<br />
8µ<br />
m)<br />
= 599 / 237 = 2.<br />
5<br />
(4.13)<br />
0<br />
( 0<br />
Calibration 41 Color Correction