IRAC Instrument Handbook - IRSA - California Institute of Technology
IRAC Instrument Handbook - IRSA - California Institute of Technology
IRAC Instrument Handbook - IRSA - California Institute of Technology

Create successful ePaper yourself
Turn your PDF publications into a flip-book with our unique Google optimized e-Paper software.
<strong>IRAC</strong> <strong>Instrument</strong> <strong>Handbook</strong><br />
photometry). And in the presence <strong>of</strong> extended emission, a small <strong>of</strong>f-source annulus is normally used. The<br />
calibration aperture does not capture all <strong>of</strong> the light from the calibration sources, so the extended emission<br />
appears too bright in the data products we delivered. See the more detailed discussion under 4.11.<br />
Similarly, observers will <strong>of</strong>ten use smaller apertures and will want to correct their photometry to match<br />
the absolute calibration.<br />
Users should note that the spatial extent <strong>of</strong> the PSF in channels 3 and 4 is much larger than the subarray<br />
area. In other words, a large amount <strong>of</strong> the total power in the PSF is scattered onto arcminute size scales.<br />
As a result, special care needs to be taken when measuring fluxes in these channels, since accurate<br />
measurement <strong>of</strong> the “background" is difficult. Proper application <strong>of</strong> aperture corrections is very<br />
important.<br />
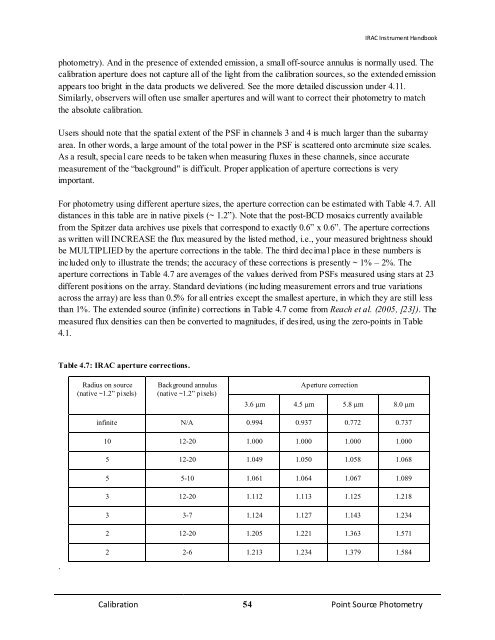
For photometry using different aperture sizes, the aperture correction can be estimated with Table 4.7. All<br />
distances in this table are in native pixels (~ 1.2”). Note that the post-BCD mosaics currently available<br />
from the Spitzer data archives use pixels that correspond to exactly 0.6” x 0.6”. The aperture corrections<br />
as written will INCREASE the flux measured by the listed method, i.e., your measured brightness should<br />
be MULTIPLIED by the aperture corrections in the table. The third decimal place in these numbers is<br />
included only to illustrate the trends; the accuracy <strong>of</strong> these corrections is presently ~ 1% – 2%. The<br />
aperture corrections in Table 4.7 are averages <strong>of</strong> the values derived from PSFs measured using stars at 23<br />
different positions on the array. Standard deviations (including measurement errors and true variations<br />
across the array) are less than 0.5% for all entries except the smallest aperture, in which they are still less<br />
than 1%. The extended source (infinite) corrections in Table 4.7 come from Reach et al. (2005, [23]). The<br />
measured flux densities can then be converted to magnitudes, if desired, using the zero-points in Table<br />
4.1.<br />
Table 4.7: <strong>IRAC</strong> aperture corrections.<br />
.<br />
Radius on source<br />
(native ~1.2” pixels)<br />
Background annulus<br />
(native ~1.2” pixels)<br />
Aperture correction<br />
3.6 µm 4.5 µm 5.8 µm 8.0 µm<br />
infinite N/A 0.994 0.937 0.772 0.737<br />
10 12-20 1.000 1.000 1.000 1.000<br />
5 12-20 1.049 1.050 1.058 1.068<br />
5 5-10 1.061 1.064 1.067 1.089<br />
3 12-20 1.112 1.113 1.125 1.218<br />
3 3-7 1.124 1.127 1.143 1.234<br />
2 12-20 1.205 1.221 1.363 1.571<br />
2 2-6 1.213 1.234 1.379 1.584<br />
Calibration 54 Point Source Photometry