IRAC Instrument Handbook - IRSA - California Institute of Technology
IRAC Instrument Handbook - IRSA - California Institute of Technology
IRAC Instrument Handbook - IRSA - California Institute of Technology

Create successful ePaper yourself
Turn your PDF publications into a flip-book with our unique Google optimized e-Paper software.
<strong>IRAC</strong> <strong>Instrument</strong> <strong>Handbook</strong><br />
concentrate the scattered light along the rows and columns, causing the optical banding. The pattern is<br />
due to interference that depends on wavelength and the spatial extent <strong>of</strong> the source at each wavelength.<br />
The banding/scattering pattern does not vary much for point sources with a continuous spectrum, but a<br />
narrow-band source has a complex banding/scattering pattern.<br />
Users should be aware <strong>of</strong> the uncertainties resulting from banding, specifically when attempting<br />
measurements <strong>of</strong> faint sources near the affected rows or columns. For bright sources with significant<br />
banding, aperture photometry may not be successful, and it would be better to measure these sources<br />
using frames <strong>of</strong> shorter exposure times. Users are encouraged to experiment with image restoration<br />
techniques <strong>of</strong> their choice. Algorithms similar to the pull-down corrector may have some effectiveness in<br />
mitigating banding.<br />
7.3.3 Optical Ghosts<br />
There are three types <strong>of</strong> known or potential optical ghosts visible in <strong>IRAC</strong> images. The brightest and most<br />
common ghosts are produced by internal reflections within the filters. The first-order filter ghosts (one<br />
pair <strong>of</strong> internal reflections) in channels 1 and 2 are triangular, and in the BCD images they appear above<br />
and/or to the left <strong>of</strong> the star in channel 1, and above and/or to the right <strong>of</strong> the star in channel 2. The<br />
channel 1 first order filter ghost contains ~ 0.5% <strong>of</strong> the flux <strong>of</strong> the main PSF in channel 1, and the channel<br />
2 ghost ~ 0.8% <strong>of</strong> the flux <strong>of</strong> the channel 2 PSF. Because <strong>of</strong> the increase in the optical path length, ghost<br />
images are not in focus. The separation between the main image and its ghost is roughly proportional to<br />
the distance <strong>of</strong> the main image from the Spitzer optical axis in both Y and Z directions, i.e., (DeltaY,<br />
DeltaZ) = (Ayy+ By, Azz+ Bz) where (y,z) are normalized coordinates in which the FPAs span the range<br />
[0,1] with the axes increasing away from the Spitzer optical axis, and the coefficients are as listed in<br />
Table 7.4 below. The +Y direction is in the <strong>IRAC</strong> (C)BCD +x direction and the +Z direction is in the<br />
<strong>IRAC</strong> (C)BCD –y direction. The peak intensity <strong>of</strong> the ghost is roughly 0.05% <strong>of</strong> the (unsaturated) peak<br />
intensity <strong>of</strong> the star. The second-order filter ghosts (two pairs <strong>of</strong> internal reflections) are much fainter (~<br />
25% <strong>of</strong> the flux and ~ 6% <strong>of</strong> the surface brightness <strong>of</strong> the first order ghosts), rounder, larger, and about<br />
twice as far away from the star. The separation between the star and its ghosts increases with distance<br />
from the optical axis <strong>of</strong> the telescope. The channel 3 and 4 filter ghosts appear as small crosses at a larger<br />
distance, mostly to the left or right <strong>of</strong> the star, respectively. They are <strong>of</strong>fset from the primary image by<br />
approximately (+36 pix, +2 pix) and (-36 pix,+2 pix) in the Spitzer (Y,Z) directions for channels 3 and 4<br />
respectively. The Z-<strong>of</strong>fset varies slightly with position on the array. The channel 3 and 4 filter ghosts<br />
contain < 0.2% <strong>of</strong> the flux <strong>of</strong> the main PSF in these channels. The separation and orientation are different<br />
from channels 1 and 2 because <strong>of</strong> the different orientations <strong>of</strong> the filters. Examples <strong>of</strong> filter ghosts are<br />
shown in Figure 7.16.<br />
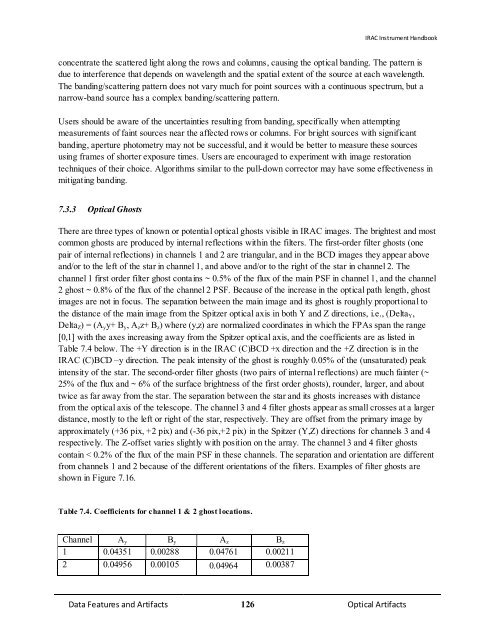
Table 7.4. Coefficients for channel 1 & 2 ghost locations.<br />
Channel Ay By Az Bz<br />
1 0.04351 0.00288 0.04761 0.00211<br />
2 0.04956 0.00105 0.04964 0.00387<br />
Data Features and Artifacts 126 Optical Artifacts