Attention! Your ePaper is waiting for publication!
By publishing your document, the content will be optimally indexed by Google via AI and sorted into the right category for over 500 million ePaper readers on YUMPU.
This will ensure high visibility and many readers!

Your ePaper is now published and live on YUMPU!
You can find your publication here:
Share your interactive ePaper on all platforms and on your website with our embed function

General Chemistry Principles, Patterns, and Applications, 2011
General Chemistry Principles, Patterns, and Applications, 2011
General Chemistry Principles, Patterns, and Applications, 2011

You also want an ePaper? Increase the reach of your titles
YUMPU automatically turns print PDFs into web optimized ePapers that Google loves.
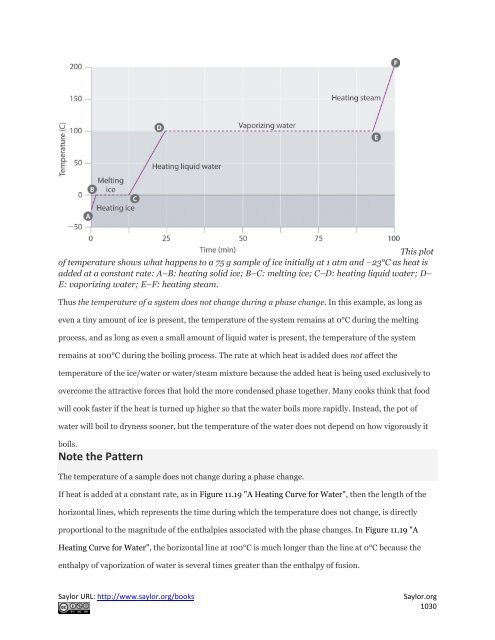
This plot<br />
of temperature shows what happens to a 75 g sample of ice initially at 1 atm <strong>and</strong> −23°C as heat is<br />
added at a constant rate: A–B: heating solid ice; B–C: melting ice; C–D: heating liquid water; D–<br />
E: vaporizing water; E–F: heating steam.<br />
Thus the temperature of a system does not change during a phase change. In this example, as long as<br />
even a tiny amount of ice is present, the temperature of the system remains at 0°C during the melting<br />
process, <strong>and</strong> as long as even a small amount of liquid water is present, the temperature of the system<br />
remains at 100°C during the boiling process. The rate at which heat is added does not affect the<br />
temperature of the ice/water or water/steam mixture because the added heat is being used exclusively to<br />
overcome the attractive forces that hold the more condensed phase together. Many cooks think that food<br />
will cook faster if the heat is turned up higher so that the water boils more rapidly. Instead, the pot of<br />
water will boil to dryness sooner, but the temperature of the water does not depend on how vigorously it<br />
boils.<br />
Note the Pattern<br />
The temperature of a sample does not change during a phase change.<br />
If heat is added at a constant rate, as in Figure 11.19 "A Heating Curve for Water", then the length of the<br />
horizontal lines, which represents the time during which the temperature does not change, is directly<br />
proportional to the magnitude of the enthalpies associated with the phase changes. In Figure 11.19 "A<br />
Heating Curve for Water", the horizontal line at 100°C is much longer than the line at 0°C because the<br />
enthalpy of vaporization of water is several times greater than the enthalpy of fusion.<br />
Saylor URL: http://www.saylor.org/books<br />
Saylor.org<br />
1030


This plot of temperature shows what happens to a 75 g sample of ice initially at 1 atm <strong>and</strong> −23°C as heat is added at a constant rate: A–B: heating solid ice; B–C: melting ice; C–D: heating liquid water; D– E: vaporizing water; E–F: heating steam. Thus the temperature of a system does not change during a phase change. In this example, as long as even a tiny amount of ice is present, the temperature of the system remains at 0°C during the melting process, <strong>and</strong> as long as even a small amount of liquid water is present, the temperature of the system remains at 100°C during the boiling process. The rate at which heat is added does not affect the temperature of the ice/water or water/steam mixture because the added heat is being used exclusively to overcome the attractive forces that hold the more condensed phase together. Many cooks think that food will cook faster if the heat is turned up higher so that the water boils more rapidly. Instead, the pot of water will boil to dryness sooner, but the temperature of the water does not depend on how vigorously it boils. Note the Pattern The temperature of a sample does not change during a phase change. If heat is added at a constant rate, as in Figure 11.19 "A Heating Curve for Water", then the length of the horizontal lines, which represents the time during which the temperature does not change, is directly proportional to the magnitude of the enthalpies associated with the phase changes. In Figure 11.19 "A Heating Curve for Water", the horizontal line at 100°C is much longer than the line at 0°C because the enthalpy of vaporization of water is several times greater than the enthalpy of fusion. Saylor URL: http://www.saylor.org/books Saylor.org 1030
A superheated liquid is a sample of a liquid at the temperature <strong>and</strong> pressure at which it should be a gas. Superheated liquids are not stable; the liquid will eventually boil, sometimes violently. The phenomenon of superheating causes “bumping” when a liquid is heated in the laboratory. When a test tube containing water is heated over a Bunsen burner, for example, one portion of the liquid can easily become too hot. When the superheated liquid converts to a gas, it can push or “bump” the rest of the liquid out of the test tube. Placing a stirring rod or a small piece of ceramic (a “boiling chip”) in the test tube allows bubbles of vapor to form on the surface of the object so the liquid boils instead of becoming superheated. Superheating is the reason a liquid heated in a smooth cup in a microwave oven may not boil until the cup is moved, when the motion of the cup allows bubbles to form. Cooling Curves The cooling curve, a plot of temperature versus cooling time, in Figure 11.20 "A Cooling Curve for Water" plots temperature versus time as a 75 g sample of steam, initially at 1 atm <strong>and</strong> 200°C, is cooled. Although we might expect the cooling curve to be the mirror image of the heating curve in Figure 11.19 "A Heating Curve for Water", the cooling curve is not an identical mirror image. As heat is removed from the steam, the temperature falls until it reaches 100°C. At this temperature, the steam begins to condense to liquid water. No further temperature change occurs until all the steam is converted to the liquid; then the temperature again decreases as the water is cooled. We might expect to reach another plateau at 0°C, where the water is converted to ice; in reality, however, this does not always occur. Instead, the temperature often drops below the freezing point for some time, as shown by the little dip in the cooling curve below 0°C. This region corresponds to an unstable form of the liquid, a supercooled liquid. If the liquid is allowed to st<strong>and</strong>, if cooling is continued, or if a small crystal of the solid phase is added (a seed crystal), the supercooled liquid will convert to a solid, sometimes quite suddenly. As the water freezes, the temperature increases slightly due to the heat evolved during the freezing process <strong>and</strong> then holds constant at the melting point as the rest of the water freezes. Subsequently, the temperature of the ice decreases again as more heat is removed from the system. Figure 11.20 A Cooling Curve for Water Saylor URL: http://www.saylor.org/books Saylor.org 1031
- Page 2 and 3:
This text was adapted by The Saylor
- Page 4 and 5:
third, it provides a review for tho
- Page 6 and 7:
Chapter 1 Introduction to Chemistry
- Page 8 and 9:
accounting for only 0.0000001% of E
- Page 10 and 11:
eginning scientist who intends to s
- Page 12 and 13:
elements by mass. Thus sodium chlor
- Page 14 and 15:
Strategy: Refer to the definitions
- Page 16 and 17:
Chemists study the structures, phys
- Page 18 and 19:
kerosene, diesel fuel, and lubricat
- Page 20 and 21:
Solution: a. A Tea is a solution of
- Page 22 and 23:
centimeter (g/cm 3 ). As mass incre
- Page 24 and 25:
contrast, the mass of sample E is s
- Page 26 and 27:
e. the sensitivity of the volume to
- Page 28 and 29:
15. Classify each statement as an e
- Page 30 and 31:
8. Gold has a density of 19.30 g/cm
- Page 32 and 33:
know to be carbon dioxide, is the s
- Page 34 and 35:
as did the first. But what was the
- Page 36 and 37:
. Ratios of 3.0 and 2.0 give 1.8 g
- Page 38 and 39:
Summary The ancient Greeks first pr
- Page 40 and 41:
1. Electrons and protons have elect
- Page 42 and 43:
well before he was run over by a ho
- Page 44 and 45:
In a single famous experiment, howe
- Page 46 and 47:
The dates in parentheses are the ye
- Page 48 and 49:
C O N C E PTUAL P R OBLEMS 1. Descr
- Page 50 and 51:
As described in Section 1.7 "Introd
- Page 52 and 53:
In with 8 neutrons and 6 protons. T
- Page 54 and 55:
Solution: A The element with 82 pro
- Page 56 and 57:
the isotopes. Because most elements
- Page 58 and 59:
The mass of an atom is a weighted a
- Page 60 and 61:
2. Determine the number of protons,
- Page 62 and 63:
The elements are arranged in a peri
- Page 64 and 65:
exhibit manic-depressive, or bipola
- Page 66 and 67:
f. nickel g. potassium h. radon i.
- Page 68 and 69:
10. Based on their locations in the
- Page 70 and 71:
emoved, minimize inadvertent contam
- Page 72 and 73:
supplements. Second, as shown in Fi
- Page 74 and 75:
Measurement Instruments of Measurem
- Page 76 and 77:
Base Quantity Unit Name Abbreviatio
- Page 78 and 79:
g. 2002.080 h. 0.01020 Solution a.
- Page 80 and 81:
( 6 .0 22 × 1 0 23 ) ( 6 . 42 × 1
- Page 82 and 83:
f. infinite (rule 5) S K I L L BUIL
- Page 84 and 85:
In the worked examples in this text
- Page 86 and 87:
The deviations are 1.125 g − 1.11
- Page 88 and 89:
Please be sure you are familiar wit
- Page 90 and 91:
Isotope Percent Abundance (%) Atomi
- Page 92 and 93:
2.1 Chemical Compounds L E A R N I
- Page 94 and 95:
Compounds that consist primarily of
- Page 96 and 97:
a. Nitrous oxide, also called “la
- Page 98 and 99:
Figure 2.3 The Three-Dimensional St
- Page 100 and 101:
group or as a water molecule in whi
- Page 102 and 103:
Answer: a. CHCl 3 a. N 2H 4 b. C 4H
- Page 104 and 105:
Figure 2.6 The Effect of Charge and
- Page 106 and 107:
Predict the charge on the most comm
- Page 108 and 109:
(a) The positively and negatively c
- Page 110 and 111:
1. The structural formula for chlor
- Page 112 and 113:
ANSWERS 5. a. 27 b. 38 c. 54 d. 28
- Page 114 and 115:
Asked for: empirical formula for bi
- Page 116 and 117:
Formula NH4 + CH3NH3 + OH − O2 2
- Page 118 and 119:
. A The potassium cation is K + , a
- Page 120 and 121:
d. H 2 S e. NaC 2 H 3 O 2 4. Genera
- Page 122 and 123:
. B 2 H 6 c. C 6 H 12 O 6 d. P 4 O
- Page 124 and 125:
1. Place the ions in their proper o
- Page 126 and 127:
more oxygen atoms ends in -ate, and
- Page 128 and 129:
Write the systematic name (and the
- Page 130 and 131:
Compounds and Covalent Molecular Su
- Page 132 and 133:
2− h. C 2 O 4 3. Name each anion.
- Page 134 and 135:
A N S W E R 1. a. rubidium bromide
- Page 136 and 137:
a. sodium hydroxide b. calcium cyan
- Page 138 and 139:
. Prefixes derived from Greek stems
- Page 140 and 141:
a. A Because sulfur is to the left
- Page 142 and 143:
in Chapter 7 "The Periodic Table an
- Page 144 and 145:
Name Number of Carbon Atoms Molecul
- Page 146 and 147:
groups are on the same side of the
- Page 148 and 149:
alkane, the alkene, or the alkyne.
- Page 150 and 151:
c. 2-butyne d. cyclooctene Given: n
- Page 152 and 153:
c. HC≡C(CH 2) 4CH 3 d. e. The gen
- Page 154 and 155:
ends of the chain connected to form
- Page 156 and 157:
e. 7. For each structural formula,
- Page 158 and 159:
. neptunium(IV) oxide c. iron(II) s
- Page 160 and 161:
e. 2.5 Acids and Bases LEARNING OBJ
- Page 162 and 163:
Figure 2.20 The Relationship betwee
- Page 164 and 165:
Figure 2.21 Some Common Carboxylic
- Page 166 and 167:
Common acids and the polyatomic ani
- Page 168 and 169:
f. H 2 SO 4 7. Draw the structure o
- Page 170 and 171:
4. Name each compound. a. H 2 SO 4
- Page 172 and 173:
chemicals are either fertilizers (a
- Page 174 and 175:
accomplish this transformation is c
- Page 176 and 177:
years was tetraethyllead [(C2H5)4Pb
- Page 178 and 179:
(from the Latin vitrum, meaning “
- Page 180 and 181:
(K2O). The usual source of potassiu
- Page 182 and 183:
7. ♦ Sodamide, or sodium amide, i
- Page 184 and 185:
As you learned in Chapter 1 "Introd
- Page 186 and 187:
E X A M P L E 2 Calculate the formu
- Page 188 and 189:
12—is also arbitrary. The importa
- Page 190 and 191:
chemists to calculate the mass of a
- Page 192 and 193:
mass of ethylene glycol (g) molar m
- Page 194 and 195:
a. 1.71 g b. 0.721 g Summary The mo
- Page 196 and 197:
. c. d. e. 5. Calculate the molar m
- Page 198 and 199:
a. b. 8. Calculate the number of mo
- Page 200 and 201:
Substance Mass (g) Number of Moles
- Page 202 and 203:
We could also calculate the mass pe
- Page 204 and 205:
Determining the Empirical Formula o
- Page 206 and 207:
possible. To obtain whole numbers,
- Page 208 and 209:
Because there are two phosphorus at
- Page 210 and 211:
A Use the masses and molar masses o
- Page 212 and 213:
lood. At this point, we cannot know
- Page 214 and 215:
C Multiply each subscript in the em
- Page 216 and 217:
The empirical formula of a substanc
- Page 218 and 219:
15. Calculate the mass percentage o
- Page 220 and 221:
2. Salicylic acid is used to make a
- Page 222 and 223:
23. a. 27.6 mg C and 1.98 mg H b. 5
- Page 224 and 225:
sides. Equation 3.9 and Equation 3.
- Page 226 and 227:
Construct a table showing how to in
- Page 228 and 229:
Equation 3.11 C 7 H 16 (l) + O 2 (g
- Page 230 and 231:
Given: reactants and product Asked
- Page 232 and 233:
4. What information can be obtained
- Page 234 and 235:
A balanced chemical equation gives
- Page 236 and 237:
mass of CO 2 = 1 .51 mol CO 2 × 44
- Page 238 and 239:
The volatility and toxicity of merc
- Page 240 and 241:
4. Convert the number of moles of p
- Page 242 and 243:
B We need to calculate the number o
- Page 244 and 245:
Given: masses of reactants and prod
- Page 246 and 247:
The stoichiometry of a reaction des
- Page 248 and 249:
e. 10.648 g of Ba 3 (PO 4 ) 2 f. 5.
- Page 250 and 251:
13. Under the proper conditions, am
- Page 252 and 253:
2 PaI 5 (s) → Δ 2 Pa(s) + 5I 2 (
- Page 254 and 255:
c. 0.923 kg K 3 PO 4 d. 0.458 kg Ni
- Page 256 and 257:
Familiarity with a few basic types
- Page 258 and 259:
equal the total of electrons gained
- Page 260 and 261:
oxidation state of oxygen is determ
- Page 262 and 263:
. Note that (NH 4) 2SO 4 is an ioni
- Page 264 and 265:
oxidant + reductant → oxidation
- Page 266 and 267:
The following reactions have import
- Page 268 and 269:
Using Table 3.1 "Basic Types of Che
- Page 270 and 271:
eduction reaction, one atom must lo
- Page 272 and 273:
N U M E R I C A L PR O BL E M S Ple
- Page 274 and 275:
8. For each redox reaction, determi
- Page 276 and 277:
15. The reaction of X 4 (orange) wi
- Page 278 and 279:
. Na, +1; Cl, −1 c. O, −2; C, +
- Page 280 and 281:
. Each year since the mid-1970s, sc
- Page 282 and 283:
Note the important chemical species
- Page 284 and 285:
Equation 3.37 CCl 3 F(g) → light
- Page 286 and 287:
hole was first observed until about
- Page 288 and 289:
then we would have a potential cata
- Page 290 and 291:
chemistry. Before proceeding to the
- Page 292 and 293:
Because many measurements are repor
- Page 294 and 295:
Skill Builder ES5 provides practice
- Page 296 and 297:
9. Ritalin is a mild central nervou
- Page 298 and 299:
20. You have obtained a 720 mg samp
- Page 300 and 301:
Equation 1: ___ + O 2 → ___ + ___
- Page 302 and 303:
11. ♦ Lead sulfide and hydrogen p
- Page 304 and 305:
20. 21. 3Al(s) + 3NH 4 ClO 4 (s)
- Page 306 and 307:
The reaction of mercury(II) acetate
- Page 308 and 309:
to have a net charge of zero, the p
- Page 310 and 311:
that contain ions conduct electrici
- Page 312 and 313:
Figure 4.5 The Difference between S
- Page 314 and 315:
B If the compound is ionic and diss
- Page 316 and 317:
d. butanol e. pentanoic acid 10. Pr
- Page 318 and 319:
d. ammonium chloride e. propanoic a
- Page 320 and 321:
The units of molarity are therefore
- Page 322 and 323:
Figure 4.7 Preparation of 250 mL of
- Page 324 and 325:
Exercise Another solution commonly
- Page 326 and 327:
In determining the volume of stock
- Page 328 and 329:
a. Sodium hydroxide is an ionic com
- Page 330 and 331:
Solution concentrations are typical
- Page 332 and 333:
Compound Mass (g) Moles Concentrati
- Page 334 and 335:
and either the masses of solid reac
- Page 336 and 337:
US states, a blood alcohol level of
- Page 338 and 339:
In Example 7 and Example 8, the ide
- Page 340 and 341:
Either the masses or the volumes of
- Page 342 and 343:
By eliminating the spectator ions,
- Page 344 and 345:
that kind of prediction is to attem
- Page 346 and 347:
Rule 6 most carbonate (CO3 2− ) a
- Page 348 and 349:
Cl − ions. The possible products
- Page 350 and 351:
pattern of metallic silver granules
- Page 352 and 353:
arsenite (NaAsO 2), the active ingr
- Page 354 and 355:
A N S W E R 1. 3.75 g Ag 2 CrO 4 ;
- Page 356 and 357:
Because of the limitations of the A
- Page 358 and 359:
In contrast, only a fraction of the
- Page 360 and 361:
Exercise Classify each compound as
- Page 362 and 363:
Note the Pattern Acid plus base yie
- Page 364 and 365:
A Write the balanced chemical equat
- Page 366 and 367:
H + ions. For example, a 1.0 M OH
- Page 368 and 369:
Tools have been developed that make
- Page 370 and 371:
. hydrobromic acid c. methylamine d
- Page 372 and 373:
10. A 25.00 mL sample of a 0.9005 M
- Page 374 and 375:
c. 1.42 × 10 −3 mol HBr 16. 17.
- Page 376 and 377:
on a huge scale to supply the energ
- Page 378 and 379:
Equation 4.53 Al(OH) 3 (s) + 3H + (
- Page 380 and 381:
The number of electrons lost in the
- Page 382 and 383:
5. Write the oxidation and reductio
- Page 384 and 385:
contains two protons, in this case,
- Page 386 and 387:
Consequently, it has been speculate
- Page 388 and 389:
When using the activity series to p
- Page 390 and 391:
. A strip of zinc is placed in an a
- Page 392 and 393:
d. Cl 2 (aq) → ClO − 3 (aq) + C
- Page 394 and 395:
E X A M P L E 2 0 The calcium salt
- Page 396 and 397:
Glutathione is a low-molecular-weig
- Page 398 and 399:
The structure of vitamin C (ascorbi
- Page 400 and 401:
1. The titration procedure is an ap
- Page 402 and 403:
4. 5. a. titration of Ba(OH) 2 with
- Page 404 and 405:
log 10a = alog 10 = (10a) = a The s
- Page 406 and 407:
c. 1000 × 0.010 d. 200 × 3000 e.
- Page 408 and 409:
When PbCl 2 is dissolved in hot wat
- Page 410 and 411:
8. Calcium hydroxide and calcium ca
- Page 412 and 413:
1. 0.106 M acetaminophen; acetamino
- Page 414 and 415:
1. To understand the concept of ene
- Page 416 and 417:
Energy, Heat, and Work One definiti
- Page 418 and 419:
To demonstrate, let’s calculate t
- Page 420 and 421:
1 cal = 4.184J exactly 1 J = 0.2390
- Page 422 and 423:
f. the energy emitted by a cellular
- Page 424 and 425:
8. [3] As you will learn in Chapter
- Page 426 and 427:
The change in elevation between sta
- Page 428 and 429:
(a) Initially, the system (a copper
- Page 430 and 431:
Reversing a reaction or a process c
- Page 432 and 433:
Possible sources of the approximate
- Page 434 and 435:
E X A M P L E 3 When carbon is burn
- Page 436 and 437:
Equation 5.23 elements ® compound
- Page 438 and 439:
Use to identify the standard state
- Page 440 and 441:
Using , we write Equation 5.29 DHor
- Page 442 and 443:
The combustion of fats such as palm
- Page 444 and 445:
Physical changes, such as melting o
- Page 446 and 447:
definition of enthalpy : H= E + PV
- Page 448 and 449:
3. Based on the following energy di
- Page 450 and 451:
16. The following table lists value
- Page 452 and 453:
3. −20.3 kJ 4. −34.3 kJ/mol Cl
- Page 454 and 455:
Compound Specific Heat [J/(g·°C)]
- Page 456 and 457:
Passive solar system. During the da
- Page 458 and 459:
Exercise (a) If a 14.0 g chunk of g
- Page 460 and 461:
A Calculate the mass of the solutio
- Page 462 and 463:
ather than the enthalpy change (ΔH
- Page 464 and 465:
K E Y E QU A T I ON S relationship
- Page 466 and 467:
7. A solution is made by dissolving
- Page 468 and 469:
Because of their different chemical
- Page 470 and 471:
A Write balanced chemical equations
- Page 472 and 473:
the food for protein, carbohydrate,
- Page 474 and 475:
A Convert mass and height to SI uni
- Page 476 and 477:
1. Determine the amount of energy a
- Page 478 and 479:
In general, it is more efficient to
- Page 480 and 481:
Table 5.7 Properties of Different T
- Page 482 and 483:
A Write a balanced chemical equatio
- Page 484 and 485:
Most of Earth’s carbon is found i
- Page 486 and 487:
14.4°C. Even small increases, howe
- Page 488 and 489:
4. The structure of coal is quite d
- Page 490 and 491:
Figure 5.25 A Comparison of the Fah
- Page 492 and 493:
Now suppose you wish to report the
- Page 494 and 495:
3. Many biochemical processes occur
- Page 496 and 497:
d. How many kilojoules of energy ar
- Page 498 and 499:
stable compounds, and why carbon an
- Page 500 and 501:
are used in such diverse applicatio
- Page 502 and 503:
As you will soon see, the energy of
- Page 504 and 505:
1. What are the characteristics of
- Page 506 and 507:
developed in 1873 by James Clerk Ma
- Page 508 and 509:
attempt to assassinate Hitler, and
- Page 510 and 511:
the assumption that radiant energy
- Page 512 and 513:
. What is the energy in joules of a
- Page 514 and 515:
1. a. 4.59 × 10 −31 J/photon, ra
- Page 516 and 517:
In 1913, a Danish physicist, Niels
- Page 518 and 519:
Figure 6.11 The Emission of Light b
- Page 520 and 521:
Figure 6.12 Electron Transitions Re
- Page 522 and 523:
Bohr’s model of the hydrogen atom
- Page 524 and 525:
the form of a continuous emission s
- Page 526 and 527:
chambers explode in stages. (b) The
- Page 528 and 529:
process produces a cascade of photo
- Page 530 and 531:
1. Using a Bohr model and the trans
- Page 532 and 533:
Equation 6.14 m = Ec2 = hnc2 = hlc
- Page 534 and 535:
Higher-energy vibrations (overtones
- Page 536 and 537:
The Heisenberg Uncertainty Principl
- Page 538 and 539:
Einstein’s relationship between m
- Page 540 and 541:
N U M E R I C A L P R O B L E M S 1
- Page 542 and 543:
energy. Thus each wave function is
- Page 544 and 545:
(a) The density of the dots shows e
- Page 546 and 547:
B For each allowed value of l, calc
- Page 548 and 549:
nucleus) and decreases steadily wit
- Page 550 and 551:
difference between the two models i
- Page 552 and 553:
and y axis (2py), respectively. Not
- Page 554 and 555:
6.26 "The Five Equivalent 3", the p
- Page 556 and 557:
electron. When more than one electr
- Page 558 and 559:
Because of the effects of shielding
- Page 560 and 561:
probabilities in space that is ofte
- Page 562 and 563:
would be the energy of the photon?
- Page 564 and 565:
9. A p orbital is found to have one
- Page 566 and 567:
In a magnetic field, an electron ha
- Page 568 and 569:
The Aufbau Principle We construct t
- Page 570 and 571:
At oxygen, with Z = 8 and eight ele
- Page 572 and 573:
Hund’s rule tells us that the rem
- Page 574 and 575:
Solution: By placing the electrons
- Page 576 and 577:
The electron configurations of the
- Page 578 and 579:
Asked for: valence electron configu
- Page 580 and 581:
1. How many magnetic quantum number
- Page 582 and 583:
f. palladium g. bismuth h. europium
- Page 584 and 585:
1. For a 4p subshell, n = 4 and l =
- Page 586 and 587:
joules of a mole of photons emitted
- Page 588 and 589:
Wavelength (nm) Color of Light 622-
- Page 590 and 591:
13. A new element is believed to ha
- Page 592 and 593:
Newlands’s table had no logical p
- Page 594 and 595:
masses 44, 68, 72, and 100, in the
- Page 596 and 597:
Despite its usefulness, Mendeleev
- Page 598 and 599:
3. How did Moseley’s contribution
- Page 600 and 601:
definite than those images suggest.
- Page 602 and 603:
Covalent atomic radii can be determ
- Page 604 and 605:
greater the effective nuclear charg
- Page 606 and 607:
A These elements are not all in the
- Page 608 and 609:
Gray circles indicate the sizes of
- Page 610 and 611:
Source: R. D. Shannon, “Revised e
- Page 612 and 613:
12. How is an isoelectronic series
- Page 614 and 615:
Ionization Energies Because atoms d
- Page 616 and 617:
There is a decrease in ionization e
- Page 618 and 619:
Given: three elements Asked for: el
- Page 620 and 621:
Consequently, ionization energies g
- Page 622 and 623:
The darkness of the shading inside
- Page 624 and 625:
Equation 7.6 E(g)+e−→E−(g) en
- Page 626 and 627:
Figure 7.13 Electron Affinities (in
- Page 628 and 629:
electron repulsions in a dianion ar
- Page 630 and 631:
found in the upper right corner of
- Page 632 and 633:
Pauling won two Nobel Prizes, one f
- Page 634 and 635:
one of the most fundamental we can
- Page 636 and 637:
The general trends for the first io
- Page 638 and 639:
4. Most of the first row transition
- Page 640 and 641:
a. As, Bi, and N b. O, F, and Ar c.
- Page 642 and 643:
however, because the I 3 values cor
- Page 644 and 645:
We have said that elements with the
- Page 646 and 647:
plaster of Paris. Magnesium and ber
- Page 648 and 649:
Group 14 The group 14 elements stra
- Page 650 and 651:
In contrast to the layered structur
- Page 652 and 653:
H3PO4. Antimony and bismuth are rel
- Page 654 and 655:
an ns 2 np 5 valence electron confi
- Page 656 and 657:
welding and in the manufacture of r
- Page 658 and 659:
Strategy: A Based on the conductivi
- Page 660 and 661:
1. Of the group 1 elements, which w
- Page 662 and 663:
7. In an attempt to explore the che
- Page 664 and 665:
three np 3 electrons; and −3, due
- Page 666 and 667:
and iodine as iodide (I − ) and i
- Page 668 and 669:
When people who exercise vigorously
- Page 670 and 671:
Given: element and data in Table 1.
- Page 672 and 673:
containing Zn 2+ ? Why or why not?
- Page 674 and 675:
covalent compounds that dissolve in
- Page 676 and 677:
where the electrostatic repulsions
- Page 678 and 679:
Exercise Calculate the amount of en
- Page 680 and 681:
At r < r 0 , the energy of the syst
- Page 682 and 683:
Substance U (kJ/mol) MgI2 2293 NaOH
- Page 684 and 685:
lowest lattice energy, and GaP, wit
- Page 686 and 687:
and a thermochemical cycle called t
- Page 688 and 689:
Source: Data from CRC Handbook of C
- Page 690 and 691:
Equation 8.7 may be used as a tool
- Page 692 and 693:
Thus U for BaO is slightly more tha
- Page 694 and 695:
Ionic compounds have strong electro
- Page 696 and 697:
"Selected Enthalpies of Sublimation
- Page 698 and 699:
atom. An exception to the octet rul
- Page 700 and 701:
Electron-electron and proton-proton
- Page 702 and 703:
We can illustrate the formation of
- Page 704 and 705:
2. Each hydrogen atom (group 1) has
- Page 706 and 707:
Adding three lone pairs each to oxy
- Page 708 and 709:
Elements may form multiple bonds to
- Page 710 and 711:
formal charge = ( ) valence e - fre
- Page 712 and 713:
If an atom in a molecule or ion has
- Page 714 and 715:
sulfur has a formal charge of +1. C
- Page 716 and 717:
2. Carbon has 4 valence electrons,
- Page 718 and 719:
Three carbon atoms now have an octe
- Page 720 and 721:
a. volatility. b. melting point. c.
- Page 722 and 723:
h. NH 4 + . 8. Draw Lewis electron
- Page 724 and 725:
2. Draw the most likely structure f
- Page 726 and 727:
7. a. 11 b. 8 c. 8 d. 8 e. 14 f. 8
- Page 728 and 729:
. Sr is the reductant; Br is the ox
- Page 730 and 731:
There are three equivalent resonanc
- Page 732 and 733:
The octet rule is based on the fact
- Page 734 and 735:
Note the Pattern Electron-deficient
- Page 736 and 737:
General exceptions to the octet rul
- Page 738 and 739:
As you learned in Chapter 4 "Reacti
- Page 740 and 741:
dioxide to give the bicarbonate ion
- Page 742 and 743:
1. In each reaction, identify the L
- Page 744 and 745:
Compound Bond Order Bond Length (pm
- Page 746 and 747:
Figure 8.11 The Strength of Covalen
- Page 748 and 749:
Bonds Broken (kJ/mol) Bonds Formed
- Page 750 and 751:
DHrxn » å(bond energies of bonds
- Page 752 and 753:
. Cl-Cl, I-I c. O-O, Se-Se d. S-S,
- Page 754 and 755:
atom. Electron-rich (negatively cha
- Page 756 and 757:
In the absence of a field (a), the
- Page 758 and 759:
moment by writing an arrow above th
- Page 760 and 761:
A The charge on each atom is given
- Page 762 and 763:
e. Na 2 S f. SiO 2 g. LiBr 5. If th
- Page 764 and 765:
. Draw Lewis electron structures fo
- Page 766 and 767:
Chapter 9 Molecular Geometry and Co
- Page 768 and 769:
We can use the VSEPR model to predi
- Page 770 and 771:
*Lone pairs are shown using a dashe
- Page 772 and 773:
(Figure 9.2 "Geometries for Species
- Page 774 and 775:
AX 2 E: SO 2 1. The central atom, s
- Page 776 and 777:
Four Electron Groups One of the lim
- Page 778 and 779:
structure of PCl5 is 2 n. There are
- Page 780 and 781:
The three lone pairs of electrons h
- Page 782 and 783:
AX 4 E 2 : ICl 4 − 1. The central
- Page 784 and 785:
2. B There are five bonding groups
- Page 786 and 787:
3. The structure with the lowest en
- Page 788 and 789:
We predict that all four nonhydroge
- Page 790 and 791:
(a) In CO2, the C-O bond dipoles ar
- Page 792 and 793:
of zero: Exercise Which molecule(s)
- Page 794 and 795:
a. CH3Cl b. PCl3 c. CO d. SF6 e. IF
- Page 796 and 797:
lone pairs of electrons. a. HCl b.
- Page 798 and 799:
c. d. e. four electron groups, bent
- Page 800 and 801:
14. SF6: The S-F bonds are quite po
- Page 802 and 803:
forms between the two hydrogen atom
- Page 804 and 805:
Figure 9.11 Three Different Ways to
- Page 806 and 807:
The position of the atomic nucleus
- Page 808 and 809:
Figure 9.14 A Hypothetical Stepwise
- Page 810 and 811:
Combining one ns and three np atomi
- Page 812 and 813:
3s and 3p valence subshells, can be
- Page 814 and 815:
Given: three chemical species Asked
- Page 816 and 817:
would have to be sp 3 d hybridized.
- Page 818 and 819:
4. Draw the molecular structure, in
- Page 820 and 821:
. sp 3 , pyramidal c. sp 2 , trigon
- Page 822 and 823:
1s atomic orbitals on the two hydro
- Page 824 and 825:
these orbitals are shown in the ene
- Page 826 and 827:
calculated bond order to predict th
- Page 828 and 829:
A Two He 1s atomic orbitals combine
- Page 830 and 831:
(a) For alkali metal diatomic molec
- Page 832 and 833:
C Calculate the bond order and pred
- Page 834 and 835:
Overlap of atomic orbital lobes wit
- Page 836 and 837:
Although many combinations of atomi
- Page 838 and 839:
Bond Orders in Selected Gas-Phase M
- Page 840 and 841:
Unlike earlier diagrams, only the m
- Page 842 and 843:
Each sulfur atom contributes 6 vale
- Page 844 and 845:
Recently, however, nitric oxide has
- Page 846 and 847:
The hydrogen 1s atomic orbital inte
- Page 848 and 849:
computed molecular orbitals extend
- Page 850 and 851:
Molecular orbital theory is able to
- Page 852 and 853:
25. How does electron screening aff
- Page 854 and 855:
oxidation or a reduction to improve
- Page 856 and 857:
a. Adding an electron to an antibon
- Page 858 and 859:
1. To explain resonance structures
- Page 860 and 861:
The two 2p orbitals on each carbon
- Page 862 and 863:
σ-bonding framework: Carbon and ox
- Page 864 and 865:
With a molecular orbital approach t
- Page 866 and 867:
The σ bonds and lone pairs account
- Page 868 and 869:
Figure 9.37 π Bonding in 1,3-Butad
- Page 870 and 871:
in dim light. Once again, a molecul
- Page 872 and 873:
3. ♦ Saccharin is an artificial s
- Page 874 and 875:
Chapter 10 Gases In Chapter 6 "The
- Page 876 and 877:
gases (group 18) are monatomic gase
- Page 878 and 879:
While gases have a wide array of us
- Page 880 and 881:
2. Determine whether the melting po
- Page 882 and 883:
is heated, the increased kinetic en
- Page 884 and 885:
a. 3.27 × 10 4 Pa (4.74 lb/in. 2 )
- Page 886 and 887:
Each square meter of Earth’s surf
- Page 888 and 889:
Mercury barometers have been used t
- Page 890 and 891:
If the tube is open to the atmosphe
- Page 892 and 893:
another unit of pressure: 1 atmosph
- Page 894 and 895:
6. If you constructed a manometer t
- Page 896 and 897:
(a) Initially the gas is at a press
- Page 898 and 899:
10.8 "The Relationship between Volu
- Page 900 and 901:
Note the Pattern For a sample of ga
- Page 902 and 903:
4. Use Boyle’s law to explain why
- Page 904 and 905:
V = ( constant)(nTP) By convention,
- Page 906 and 907:
Equation 10.17 V = nRTP = ( constan
- Page 908 and 909:
C Equate the ratios of those terms
- Page 910 and 911:
Initial V 0.406 L n 0.025 mol 0.406
- Page 912 and 913:
Thus all the quantities except V 2
- Page 914 and 915:
M = dRTP Exercise Radon (Rn) is a r
- Page 916 and 917:
density, 58 g/L. The major constitu
- Page 918 and 919:
7. Given the following information
- Page 920 and 921:
6. Calculate the volume in liters o
- Page 922 and 923:
a. 0.21 g HI; b. 840 g H 2 S; c. 0.
- Page 924 and 925:
The total pressure of a mixture of
- Page 926 and 927:
The composition of a gas mixture ca
- Page 928 and 929:
P A X A PCO2 PH 2O (28 mmHg) 0.031
- Page 930 and 931:
Elevation (km) Pressure in Summer (
- Page 932 and 933:
moles O2 = (9250 mol H 2SO4) (1.5 m
- Page 934 and 935:
Temperatures"). As shown in Figure
- Page 936 and 937:
A 1.00 g sample of zinc metal is ad
- Page 938 and 939:
. 604 mL O 2 5. Percent composition
- Page 940 and 941:
The square root of v2¯¯¯ is the
- Page 942 and 943:
Figure 10.14 The Distributions of M
- Page 944 and 945:
Solution: a. Increasing the tempera
- Page 946 and 947:
ut in this experiment, two cotton b
- Page 948 and 949:
During World War II, scientists wor
- Page 950 and 951:
KE¯¯¯¯¯¯=12M1v2rms1=12M2v2rms
- Page 952 and 953:
other gas molecules and with the wa
- Page 954 and 955:
Root mean square speed vrms = v21+
- Page 956 and 957:
1. To recognize the differences bet
- Page 958 and 959:
Because the molecules of an ideal g
- Page 960 and 961:
Gas a (L 2·atm)/mol2 ) b (L/mol) A
- Page 962 and 963:
P = nRTV - nb - an2V 2 = (7.05 mol)
- Page 964 and 965:
volume of the gaseous molecules and
- Page 966 and 967:
are drawn using a “best-fit” ap
- Page 968 and 969:
It is important to remember that wh
- Page 970 and 971:
Absorbance (400 nm) PO4 3− (mol/L
- Page 972 and 973:
10.10 End-of-Chapter Material A P P
- Page 974 and 975:
a. Your lab is in Denver, Colorado,
- Page 976 and 977:
a. A 50.0 L reaction vessel is char
- Page 978 and 979:
Density The molecules of a liquid a
- Page 980 and 981: The kinetic molecular description o
- Page 982 and 983: Repulsive Dipole-Dipole Interaction
- Page 984 and 985: Table 11.2 Relationships between th
- Page 986 and 987: Substance Molar Mass (g/mol) Meltin
- Page 988 and 989: whereas He boils at −269°C. The
- Page 990 and 991: Determine the intermolecular forces
- Page 992 and 993: the other. In contrast, each oxygen
- Page 994 and 995: Exercise Considering CH 3CO 2H, (CH
- Page 996 and 997: more polarizable than smaller ones
- Page 998 and 999: 17. Do you expect the boiling point
- Page 1000 and 1001: it only has one O-H bond with an H
- Page 1002 and 1003: The same phenomenon holds molecules
- Page 1004 and 1005: for water, then the liquid in the c
- Page 1006 and 1007: Motor oils and other lubricants dem
- Page 1008 and 1009: 2. How is the environment of molecu
- Page 1010 and 1011: 8. Cohesive forces are the intermol
- Page 1012 and 1013: Nearly all of us have heated a pan
- Page 1014 and 1015: (a) When a liquid is introduced int
- Page 1016 and 1017: evaporate more slowly. Although the
- Page 1018 and 1019: ln(P2P1) = -DHvapR(1T 2 -1T1) Conve
- Page 1020 and 1021: oils at a temperature greater than
- Page 1022 and 1023: pressure above the liquid. Molecule
- Page 1024 and 1025: 3. The ΔH vap of carbon tetrachlor
- Page 1026 and 1027: and vice versa). We use dry ice, wh
- Page 1028 and 1029: The direct conversion of a solid to
- Page 1032 and 1033: This plot of temperature shows what
- Page 1034 and 1035: Suppose you are overtaken by a bliz
- Page 1036 and 1037: 8. Why do substances with high enth
- Page 1038 and 1039: enough energy to overcome the inter
- Page 1040 and 1041: N U M E R I C AL PROBLEMS 1. The de
- Page 1042 and 1043: 5. 45.0 kJ/mol 7. 488 kJ 9. 32.6 kJ
- Page 1044 and 1045: for a sample of benzene in Figure 1
- Page 1046 and 1047: useful in catalytic processes such
- Page 1048 and 1049: corresponds to the solid phase, whe
- Page 1050 and 1051: the solid phase. Along this line, t
- Page 1052 and 1053: satisfying, it is incorrect, as we
- Page 1054 and 1055: Given: phase diagram, temperature,
- Page 1056 and 1057: upon their relative densities. For
- Page 1058 and 1059: In the nematic phase, only the long
- Page 1060 and 1061: Applying a voltage to selected segm
- Page 1062 and 1063: d. sodium decanoate {Na[CH 3(CH 2)
- Page 1064 and 1065: T O PI C S Natural Logarithms Cal
- Page 1066 and 1067: 20.50.026 Solution: a. ln(22 × 18.
- Page 1068 and 1069: c. Using the Clausius-Clapeyron equ
- Page 1070 and 1071: Deformation of the ionic crystal ca
- Page 1072 and 1073: in amorphous form if the liquid pha
- Page 1074 and 1075: . impurities in the liquid from whi
- Page 1076 and 1077: Crystalline solids have regular ord
- Page 1078 and 1079: Figure 12.2 Unit Cells in Two Dimen
- Page 1080 and 1081:
Figure 12.4 The General Features of
- Page 1082 and 1083:
entirely within a unit cell, such a
- Page 1084 and 1085:
The arrangement of the atoms in a s
- Page 1086 and 1087:
Figure 12.7 Close-Packed Structures
- Page 1088 and 1089:
N U M E R I C A L PR O BL E M S 1.
- Page 1090 and 1091:
within a unit cell is required to a
- Page 1092 and 1093:
The most common structure based on
- Page 1094 and 1095:
Figure 12.11 The Zinc Blende Struct
- Page 1096 and 1097:
Two equivalent views are shown: (a)
- Page 1098 and 1099:
determined accurately and routinely
- Page 1100 and 1101:
More complex structures are possibl
- Page 1102 and 1103:
What is the empirical formula of th
- Page 1104 and 1105:
10. 11. Mg: 17.2°, Zn: 18.2°, Ni:
- Page 1106 and 1107:
Name of Steel Typical Composition*
- Page 1108 and 1109:
Figure 12.17 The Role of Dislocatio
- Page 1110 and 1111:
Memory Metal The compound NiTi, pop
- Page 1112 and 1113:
Sr 2+ (ionic radius = 118 pm) subst
- Page 1114 and 1115:
Figure 12.18 The Two Most Common De
- Page 1116 and 1117:
metals, lanthanides, and actinides,
- Page 1118 and 1119:
6. Substitutional impurities are of
- Page 1120 and 1121:
c. Without defects, the mass is 0.1
- Page 1122 and 1123:
Self-healing rubber is an example o
- Page 1124 and 1125:
strong covalent (C-C or Si-Si) or p
- Page 1126 and 1127:
thus producing high electrical cond
- Page 1128 and 1129:
A Locate the component element(s) i
- Page 1130 and 1131:
5. Suppose you want to synthesize a
- Page 1132 and 1133:
If the distance between the metal a
- Page 1134 and 1135:
completely populated), so they do n
- Page 1136 and 1137:
Insulators In contrast to metals, e
- Page 1138 and 1139:
Figure 12.25 A Comparison of the Ke
- Page 1140 and 1141:
The conductivity of the metal (tung
- Page 1142 and 1143:
amounts of desired impurities and a
- Page 1144 and 1145:
a. Predict the electrical propertie
- Page 1146 and 1147:
7. Carbon is an insulator, and sili
- Page 1148 and 1149:
The superconducting transition temp
- Page 1150 and 1151:
superconducting at temperatures as
- Page 1152 and 1153:
Compound Tc (K) YBa2Cu3O7−x 95 Bi
- Page 1154 and 1155:
Formation", polymerization is the p
- Page 1156 and 1157:
Many of the synthetic polymers we u
- Page 1158 and 1159:
strong, and impact resistant. Its p
- Page 1160 and 1161:
percentage of iron in wings and fus
- Page 1162 and 1163:
SiCl4 s ( ) + 4CH 3CH 2OH ( l) + 4N
- Page 1164 and 1165:
Figure 12.34 Some Possible Arrangem
- Page 1166 and 1167:
Determine under what conditions the
- Page 1168 and 1169:
a. Explain why the emitted light sh
- Page 1170 and 1171:
9. A polymerization reaction is use
- Page 1172 and 1173:
L E A R N I N G O B JE C T I V E 1.
- Page 1174 and 1175:
Solvation can be an exothermic or e
- Page 1176 and 1177:
All spontaneous processes with ΔH
- Page 1178 and 1179:
The first substance, LiCl, is an io
- Page 1180 and 1181:
The magnitude of the changes in bot
- Page 1182 and 1183:
the molecule or ion happens to coll
- Page 1184 and 1185:
sodium halides increase from NaI to
- Page 1186 and 1187:
Gas Solubility (M) × 10 −4 Xe 50
- Page 1188 and 1189:
Low-molecular-mass hydrocarbons wit
- Page 1190 and 1191:
Exercise Identify the most importan
- Page 1192 and 1193:
E X A M P L E 3 The following subst
- Page 1194 and 1195:
solution has two or more phases tha
- Page 1196 and 1197:
(a) The potassium complex of the cr
- Page 1198 and 1199:
a. cyclohexane or methanol b. I 2 o
- Page 1200 and 1201:
A N S W E R S 1. 2. 3. 4. 5. 6. 7.
- Page 1202 and 1203:
a. A The molarity is the number of
- Page 1204 and 1205:
E X A M P L E 5 Several years ago,
- Page 1206 and 1207:
Unit Definition Application percent
- Page 1208 and 1209:
d. MEtOH = (0.686 mol100 mL) \ (100
- Page 1210 and 1211:
1. Complete the following table for
- Page 1212 and 1213:
2Fe(s) + 3Br 2 (aq) → 2FeBr 3 (aq
- Page 1214 and 1215:
1. To understand the relationship a
- Page 1216 and 1217:
process (ΔHsoln < 0). Conversely,
- Page 1218 and 1219:
"Energy Sources and the Environment
- Page 1220 and 1221:
the Henry’s law constants for sol
- Page 1222 and 1223:
CO2 = kPO2 = (1.27 ´10 - 3 M / atm
- Page 1224 and 1225:
2. The solubility of O 2 in 100 g o
- Page 1226 and 1227:
(CH3CO2Na) and 50 g of KBr, we can
- Page 1228 and 1229:
ut calcium carbonate (CaCO3) is qui
- Page 1230 and 1231:
Properties of Liquids".) (b) Increa
- Page 1232 and 1233:
The Henry’s law constant for O 2
- Page 1234 and 1235:
pump. Filling the flask with nitrog
- Page 1236 and 1237:
Solubility may increase or decrease
- Page 1238 and 1239:
decrease with increasing temperatur
- Page 1240 and 1241:
External pressure has very little e
- Page 1242 and 1243:
Note the Pattern Gases that react w
- Page 1244 and 1245:
CONCEP TUAL PROBLEMS 1. Use the kin
- Page 1246 and 1247:
L E A R N I N G O B JE C T I V E 1.
- Page 1248 and 1249:
to tissues. In a common inherited d
- Page 1250 and 1251:
(a) Soaps and detergents, which con
- Page 1252 and 1253:
hydrophobic tails attached to a hyd
- Page 1254 and 1255:
must be better.” Instead of using
- Page 1256 and 1257:
Chemical Kinetics The gases, liquid
- Page 1258 and 1259:
At 180°C, however, a completely di
- Page 1260 and 1261:
Factors that influence the reaction
- Page 1262 and 1263:
The progress of a simple reaction (
- Page 1264 and 1265:
Time (h) [Aspirin] (M) [Salicylic A
- Page 1266 and 1267:
depend on the total volume of the s
- Page 1268 and 1269:
A Using the equations in Example 1,
- Page 1270 and 1271:
eactants ([R]) after a given amount
- Page 1272 and 1273:
eaction rate of the hydrolysis reac
- Page 1274 and 1275:
C Because the reaction rate is inde
- Page 1276 and 1277:
5. During the hydrolysis reaction A
- Page 1278 and 1279:
eaction order are described in this
- Page 1280 and 1281:
This graph shows the concentrations
- Page 1282 and 1283:
In a first-order reaction, the reac
- Page 1284 and 1285:
The rate law and reaction order of
- Page 1286 and 1287:
Data for the reaction at 320°C are
- Page 1288 and 1289:
A Having been given the initial con
- Page 1290 and 1291:
synthesis of drugs. Like the first-
- Page 1292 and 1293:
At high temperatures, nitrogen diox
- Page 1294 and 1295:
1[NO2]3600 = 1[NO2]0 + kt = 10.056
- Page 1296 and 1297:
8.5 ´10 - 3 M / min34 ´10 - 3 M /
- Page 1298 and 1299:
The peroxydisulfate ion (S 2O 8 2
- Page 1300 and 1301:
C 3 H 7 Br + S 2 O 3 2− → C 3 H
- Page 1302 and 1303:
These plots show the decomposition
- Page 1304 and 1305:
E X AM P L E 9 Dinitrogen pentoxide
- Page 1306 and 1307:
second order in C 4H 6; rate = k[C
- Page 1308 and 1309:
Time (s) Pressure (mmHg) 0 348 400
- Page 1310 and 1311:
experimentally. (To understand why,
- Page 1312 and 1313:
Rate-determining step. The phenomen
- Page 1314 and 1315:
This mechanism is consistent with t
- Page 1316 and 1317:
CH3· + CH3· → H3CCH3 Cl· + Cl
- Page 1318 and 1319:
3. Nitramide (O 2 NNH 2 ) decompose
- Page 1320 and 1321:
The reaction rate, not the rate con
- Page 1322 and 1323:
The diagram shows how the energy of
- Page 1324 and 1325:
Most collisions of NO and O3 molecu
- Page 1326 and 1327:
The frequency factor is used to con
- Page 1328 and 1329:
B If the activation energy of a rea
- Page 1330 and 1331:
K E Y T A K E A W A Y For a chemic
- Page 1332 and 1333:
6. The reaction rate at 25°C is 1.
- Page 1334 and 1335:
An example of heterogeneous catalys
- Page 1336 and 1337:
Commercial Process Catalyst Reactan
- Page 1338 and 1339:
6. An area of intensive chemical re
- Page 1340 and 1341:
substrate concentrations, the plot
- Page 1342 and 1343:
9. ♦ L-Aspartic acid is an amino
- Page 1344 and 1345:
13. Figure 14.27 "Hydrogenation of
- Page 1346 and 1347:
the ratio of the reaction rate of t
- Page 1348 and 1349:
Chemical Equilibrium In Chapter 14
- Page 1350 and 1351:
(a) Initially, this idealized syste
- Page 1352 and 1353:
Given: three reaction systems Asked
- Page 1354 and 1355:
1. To know the relationship between
- Page 1356 and 1357:
K = [ C]c[ D]d[ A]a[ B]b where K is
- Page 1358 and 1359:
corresponds to an essentially irrev
- Page 1360 and 1361:
Use the value of the equilibrium co
- Page 1362 and 1363:
K¢¢ = [N2O4]1/ 2[NO2] The values
- Page 1364 and 1365:
where K is the equilibrium constant
- Page 1366 and 1367:
Incorporating all the constant valu
- Page 1368 and 1369:
Note the Pattern The concentrations
- Page 1370 and 1371:
18S8( s) +O2( g) SO2( g) K1= 4.4 ´
- Page 1372 and 1373:
A more complex example of this type
- Page 1374 and 1375:
chemical equation for the reaction,
- Page 1376 and 1377:
D We sum the numbers in the [NOCl]
- Page 1378 and 1379:
The water-gas shift reaction is imp
- Page 1380 and 1381:
K = 54 at 425°C. If 0.172 M H 2 an
- Page 1382 and 1383:
In many situations it is not necess
- Page 1384 and 1385:
100% to completion. When we solve t
- Page 1386 and 1387:
quantities or concentrations of the
- Page 1388 and 1389:
the reaction quotient is defined as
- Page 1390 and 1391:
Saylor URL: http://www.saylor.org/b
- Page 1392 and 1393:
Because K = 2.4 × 10 −4 , we see
- Page 1394 and 1395:
Initially the concentration of CO2(
- Page 1396 and 1397:
concentration of either HI or NH3,
- Page 1398 and 1399:
a. Because HgO(s) and Hg(l) are pur
- Page 1400 and 1401:
a. K = [CH 4][H 2S]2[CS2][H 2]4; ]
- Page 1402 and 1403:
1. To predict the effects of stress
- Page 1404 and 1405:
and the system will once again be a
- Page 1406 and 1407:
Exercise For each equilibrium syste
- Page 1408 and 1409:
c. 2NO2( g) 2NO( g) +O2( g) Given:
- Page 1410 and 1411:
Increasing the temperature (adding
- Page 1412 and 1413:
eaction with an unfavorable equilib
- Page 1414 and 1415:
the magnitudes of the two equilibri
- Page 1416 and 1417:
CH4 O2 CO2 H2O Q K remove water 0.6
- Page 1418 and 1419:
eaction mixture to NH3, as is done
- Page 1420 and 1421:
Controlling the amount of product f
- Page 1422 and 1423:
3. What effect does a catalyst have
- Page 1424 and 1425:
Thus we can obtain the solutions to
- Page 1426 and 1427:
3. ♦ Phosphorus pentachloride, an
- Page 1428 and 1429:
ecycling industry as well as in the
- Page 1430 and 1431:
c. Would an increase in pressure fa
- Page 1432 and 1433:
7. 8. 9. a. 10. 11. 1. K = [CO2]4[S
- Page 1434 and 1435:
definition you use. In practice, ch
- Page 1436 and 1437:
In pure water, the concentrations o
- Page 1438 and 1439:
As pH decreases, [H + ] and the aci
- Page 1440 and 1441:
Equation 16.10: [H + ] = 10 −pH D
- Page 1442 and 1443:
a. household bleach (11.4) b. milk
- Page 1444 and 1445:
ase. Once again, we have two conjug
- Page 1446 and 1447:
As we noted earlier, the concentrat
- Page 1448 and 1449:
CN - ( aq) + H2O( l) OH - ( aq) + H
- Page 1450 and 1451:
In an acid-base reaction, the proto
- Page 1452 and 1453:
You will notice in Table 16.2 "Valu
- Page 1454 and 1455:
The hydrogen sulfate ion (HSO4 −
- Page 1456 and 1457:
a. H2O( l) + HS -( aq) OH -( aq) +
- Page 1458 and 1459:
25°C is 5.13 or 3.12, respectively
- Page 1460 and 1461:
The contours show the electron dens
- Page 1462 and 1463:
B In contrast, SO 4 2− is the con
- Page 1464 and 1465:
c. C3H 7NO2( aq) +OH - ( aq) C3H6NO
- Page 1466 and 1467:
2. Arrange these bases in order of
- Page 1468 and 1469:
The same trend is predicted by anal
- Page 1470 and 1471:
These electrostatic potential maps
- Page 1472 and 1473:
causes electrons to be drawn from o
- Page 1474 and 1475:
Given: series of compounds Asked fo
- Page 1476 and 1477:
Inductive effects and charge deloca
- Page 1478 and 1479:
Equation 16.38 CCH 3CO2H = [CH 3CO2
- Page 1480 and 1481:
+(+0.0042 M ) = 0.0042 M[H +]f = [H
- Page 1482 and 1483:
H2O( l) + NH 3( aq) NH 4 + ( aq) +O
- Page 1484 and 1485:
Ka = [H+][HCO2-][HCO2H] = (1.00 ´1
- Page 1486 and 1487:
B To calculate the pH, we need to d
- Page 1488 and 1489:
As shown here for benzoic acid (C6H
- Page 1490 and 1491:
f. percent ionized = [PhCO2-]CPhCO2
- Page 1492 and 1493:
Equation 16.48 acidbasesumHA H + +A
- Page 1494 and 1495:
e determined, as can the pH of the
- Page 1496 and 1497:
8. The pK a of Cl 3 CCO 2 H is 0.64
- Page 1498 and 1499:
50.00 mL of distilled water, the pH
- Page 1500 and 1501:
As shown in part (b) in Figure 16.1
- Page 1502 and 1503:
of the titration. Note also that th
- Page 1504 and 1505:
All problems of this type must be s
- Page 1506 and 1507:
C If excess acetate is present afte
- Page 1508 and 1509:
weaker (its pKa or pKb becomes larg
- Page 1510 and 1511:
The curve for the titration of 25.0
- Page 1512 and 1513:
B The equilibrium between the weak
- Page 1514 and 1515:
Red cabbage juice contains a mixtur
- Page 1516 and 1517:
The graph shows the results obtaine
- Page 1518 and 1519:
3. The pK a values of phenol red, b
- Page 1520 and 1521:
. A volume of 5.0 mL of 2.55 M NaOH
- Page 1522 and 1523:
A N S W E R S 1. 2. 3. 43 mL 4. 5.
- Page 1524 and 1525:
changed; the ionization constant Ka
- Page 1526 and 1527:
HCO2H ( aq) H + ( aq) + HCO2 -( aq)
- Page 1528 and 1529:
A buffer maintains a relatively con
- Page 1530 and 1531:
Solution: a. According to the Hende
- Page 1532 and 1533:
[HCO2 − ] [H + ] [HCO2H] initial
- Page 1534 and 1535:
lower the final pH to 1.32 instead
- Page 1536 and 1537:
Adding Equation 16.63 and Equation
- Page 1538 and 1539:
K E Y T A K E A W A Y The common i
- Page 1540 and 1541:
d. Buffer; the NaOH neutralizes onl
- Page 1542 and 1543:
To understand how buffers work, let
- Page 1544 and 1545:
The initial concentrations, the cha
- Page 1546 and 1547:
If the equilibrium constant for the
- Page 1548 and 1549:
constant expression provides an eas
- Page 1550 and 1551:
Answer: a. 4.08 b. 9.68 The Henders
- Page 1552 and 1553:
[HCO2H] [OH − ] [HCO2 − ] initi
- Page 1554 and 1555:
weak acid; at the upper right, the
- Page 1556 and 1557:
According to Equation 16.65, adding
- Page 1558 and 1559:
d. mixing 100 mL of 0.1 M hydrofluo
- Page 1560 and 1561:
d. What is the final pH if 10.00 mL
- Page 1562 and 1563:
5. ♦ Fluoroacetic acid is a poiso
- Page 1564 and 1565:
calcium phosphate, one of the two m
- Page 1566 and 1567:
B Convert the solubility of the sal
- Page 1568 and 1569:
Asked for: molar concentration and
- Page 1570 and 1571:
If Q is less than Ksp, the solution
- Page 1572 and 1573:
continue to precipitate until the s
- Page 1574 and 1575:
The equilibrium constant for a diss
- Page 1576 and 1577:
c. iron(II) carbonate d. silver pho
- Page 1578 and 1579:
19. Use the data in Chapter 26 "App
- Page 1580 and 1581:
L E A R N I N G O B JE C T I V E 1.
- Page 1582 and 1583:
magnitude of attractive electrostat
- Page 1584 and 1585:
Ion-pair formation, the incomplete
- Page 1586 and 1587:
[Cu(NH3)4(H2O)2] 2+ complex ion is
- Page 1588 and 1589:
The value of x indicates that our a
- Page 1590 and 1591:
a. in pure water b. in 1.0 M KCl so
- Page 1592 and 1593:
detergents prevents the magnesium a
- Page 1594 and 1595:
Figure 17.5 An MRI Image of the Hea
- Page 1596 and 1597:
Equation 17.13 MA s ( ) M + ( aq) +
- Page 1598 and 1599:
(HO 2CCO 2H), which is a weak dipro
- Page 1600 and 1601:
table. Oxides of metallic elements
- Page 1602 and 1603:
elements are acidic oxides, which e
- Page 1604 and 1605:
H 2S aq ( ) H + ( aq) + HS - ( aq)H
- Page 1606 and 1607:
Substituting the desired oxalate co
- Page 1608 and 1609:
2. 3. No; both metal ions will prec
- Page 1610 and 1611:
in Chapter 6 "The Structure of Atom
- Page 1612 and 1613:
sample of AuCl, what is the solubil
- Page 1614 and 1615:
7. No; these cations would precipit
- Page 1616 and 1617:
absorbing heat—the flow of therma
- Page 1618 and 1619:
Using a frictionless piston, if the
- Page 1620 and 1621:
the engine chamber and the expandin
- Page 1622 and 1623:
Answer: −0.500 L·atm, or −50.7
- Page 1624 and 1625:
. How much work is done if the pers
- Page 1626 and 1627:
useful work is not fixed, as discus
- Page 1628 and 1629:
Equation 18.10 qp = DE + PDVconstan
- Page 1630 and 1631:
For reactions that result in a net
- Page 1632 and 1633:
. Assuming the heat capacity of the
- Page 1634 and 1635:
at a value between the initial temp
- Page 1636 and 1637:
for a Sample of Four Gas Molecules
- Page 1638 and 1639:
structure of water, leading to an i
- Page 1640 and 1641:
can continue indefinitely. In contr
- Page 1642 and 1643:
In the initial state (top), the tem
- Page 1644 and 1645:
In this case, ΔSfus = (6.01 kJ/mol
- Page 1646 and 1647:
a. What is ΔS for this process? b.
- Page 1648 and 1649:
. irreversible c. reversible d. irr
- Page 1650 and 1651:
only system that meets this criteri
- Page 1652 and 1653:
Substance S° [J/(mol·K)] CH3OH 12
- Page 1654 and 1655:
To calculate ΔS° for a chemical r
- Page 1656 and 1657:
Thus we can use a combination of he
- Page 1658 and 1659:
Entropy changes can be calculated u
- Page 1660 and 1661:
c. 114.5 J/K d. −173.2 J/K 4. 5.
- Page 1662 and 1663:
What about processes for which ΔG
- Page 1664 and 1665:
"Temperature Dependence of Δ" show
- Page 1666 and 1667:
Device Energy Conversion Approximat
- Page 1668 and 1669:
Calculate the standard free-energy
- Page 1670 and 1671:
Calculate ΔG° for the reaction of
- Page 1672 and 1673:
thermodynamically spontaneous, but
- Page 1674 and 1675:
free energy of formation (DG f ), i
- Page 1676 and 1677:
3. Nitrogen fixation is the process
- Page 1678 and 1679:
5. 919 K 6. 7. MgCO 3 : ΔG° = 63
- Page 1680 and 1681:
Because the free-energy change for
- Page 1682 and 1683:
Solution: In Example 10, we used ta
- Page 1684 and 1685:
ln K1ln K2 = -DH°RT1+ DS°R = -DH
- Page 1686 and 1687:
N U M E R I C A L PR O BL E M S 1.
- Page 1688 and 1689:
. What is the equilibrium constant
- Page 1690 and 1691:
Table 18.4 The Relationship between
- Page 1692 and 1693:
Even at 1000°C, ΔG is very positi
- Page 1694 and 1695:
B We can find the corresponding val
- Page 1696 and 1697:
Because cells are open systems, the
- Page 1698 and 1699:
information on respiration, see Cha
- Page 1700 and 1701:
Figure 18.19 NAD + and Its Reduced
- Page 1702 and 1703:
Thus any reaction that involves the
- Page 1704 and 1705:
An average 70 kg adult stores about
- Page 1706 and 1707:
A living cell is a system that is n
- Page 1708 and 1709:
a. standard enthalpy of combustion
- Page 1710 and 1711:
c. What is K? d. This reaction requ
- Page 1712 and 1713:
a. aerobic conversion b. −268 kJ
- Page 1714 and 1715:
Equation 19.1 Zn(s) + Br 2 (aq) →
- Page 1716 and 1717:
To illustrate the basic principles
- Page 1718 and 1719:
electric current can flow from the
- Page 1720 and 1721:
Answer: − a. MnO (aq) + 4 (aq) +
- Page 1722 and 1723:
The solution concentrations were no
- Page 1724 and 1725:
c. Which electrode is negatively ch
- Page 1726 and 1727:
19.2 Standard Potentials L E A R N
- Page 1728 and 1729:
an electrochemical reaction and the
- Page 1730 and 1731:
The SHE consists of platinum wire t
- Page 1732 and 1733:
E° values do not depend on the sto
- Page 1734 and 1735:
6H 2 O(l) + 2Al(s) + 2OH − (aq)
- Page 1736 and 1737:
In acidic solution, the redox react
- Page 1738 and 1739:
Equation 19.40 Zn(s)∣ Zn 2+ (aq,
- Page 1740 and 1741:
When using a galvanic cell to measu
- Page 1742 and 1743:
The voltage E′ is a constant that
- Page 1744 and 1745:
C O N C E PTUAL P R OBLEMS 1. Is a
- Page 1746 and 1747:
c. Fe 3+ (aq) + Cd(s) → Fe 2+ (aq
- Page 1748 and 1749:
1. To know how to predict the relat
- Page 1750 and 1751:
significantly greater ΔHhydration
- Page 1752 and 1753:
Answer: a. Ag + (aq); H 2O 2(aq) b.
- Page 1754 and 1755:
The oxidative and reductive strengt
- Page 1756 and 1757:
phenomenon of electrolysis and laid
- Page 1758 and 1759:
Use the data in Table 19.2 "Standar
- Page 1760 and 1761:
Thus E°cell is directly proportion
- Page 1762 and 1763:
ΔG = ΔG° + RT ln Q We also know
- Page 1764 and 1765:
Applying the Nernst equation to a s
- Page 1766 and 1767:
As the reaction progresses, the con
- Page 1768 and 1769:
Ecell = 0 V - (0.0591 V1)log([Ag+]d
- Page 1770 and 1771:
Another use for the Nernst equation
- Page 1772 and 1773:
measure the solubility product of a
- Page 1774 and 1775:
9. 10. N U M E R I C A L PR O BL E
- Page 1776 and 1777:
g. Is the reduction of Mn 3+ (aq) t
- Page 1778 and 1779:
c. What conditions can be changed t
- Page 1780 and 1781:
graphite, and starch (part (a) in F
- Page 1782 and 1783:
caused by the solid electrolyte, on
- Page 1784 and 1785:
anode: Cd(s) + 2OH − (aq) → Cd(
- Page 1786 and 1787:
When an external voltage in excess
- Page 1788 and 1789:
called an alkaline battery when ada
- Page 1790 and 1791:
deoxygenated water will not rust—
- Page 1792 and 1793:
Holes in a protective coating allow
- Page 1794 and 1795:
(Figure 19.20 "The Use of a Sacrifi
- Page 1796 and 1797:
a. Not unless you plan to sell the
- Page 1798 and 1799:
(a) When compartments that contain
- Page 1800 and 1801:
The electrolysis of a molten mixtur
- Page 1802 and 1803:
Equation 19.111 anode : 2H2O l Equa
- Page 1804 and 1805:
control its electrical conductivity
- Page 1806 and 1807:
Summary In electrolysis, an externa
- Page 1808 and 1809:
19.8 End-of-Chapter Material A P P
- Page 1810 and 1811:
when Cr(II) is oxidized to Cr(III)
- Page 1812 and 1813:
Metal E versus Ag/AgCl (V) Monel [N
- Page 1814 and 1815:
9. 10. 11. 12. 13. 14. 15. 16. 17.
- Page 1816 and 1817:
living organisms is 1.3 × 10 −12
- Page 1818 and 1819:
The relationship between the number
- Page 1820 and 1821:
hypothesis that the nucleus contain
- Page 1822 and 1823:
with 114 protons and 184 neutrons m
- Page 1824 and 1825:
3. Give the number of protons, the
- Page 1826 and 1827:
Chapter 20 Nuclear Chemistry Until
- Page 1828 and 1829:
living organisms is 1.3 × 10 −12
- Page 1830 and 1831:
Figure 20.1 Competing Interactions
- Page 1832 and 1833:
numbers 2, 8, 20, 50, 82, and 126.
- Page 1834 and 1835:
f. This nuclide has an atomic numbe
- Page 1836 and 1837:
5. Isotopes with magic numbers of p
- Page 1838 and 1839:
starting material. As we shall see,
- Page 1840 and 1841:
Similarly, the lower left subscript
- Page 1842 and 1843:
R88226a ® R86222n +a24 Because nuc
- Page 1844 and 1845:
The atomic numbers of the parent an
- Page 1846 and 1847:
a. A We know the identities of the
- Page 1848 and 1849:
a proton and an electron. The elect
- Page 1850 and 1851:
The first successful nuclear transm
- Page 1852 and 1853:
number of the target is 27, so the
- Page 1854 and 1855:
Data source: T. R. England and B. F
- Page 1856 and 1857:
charge. Six different kinds of nucl
- Page 1858 and 1859:
8. Which types of nuclear decay rea
- Page 1860 and 1861:
c. a. Ra ® R86220n +a 208 Tl → 8
- Page 1862 and 1863:
a. An unknown element emits γ rays
- Page 1864 and 1865:
ays, their interaction with matter
- Page 1866 and 1867:
the rem (roentgen equivalent in man
- Page 1868 and 1869:
By far the most important source of
- Page 1870 and 1871:
adiation dose per year = 2.87 ´10
- Page 1872 and 1873:
Studies on fruit flies show a linea
- Page 1874 and 1875:
1. 2. 3. Ionizing radiation is high
- Page 1876 and 1877:
Equation 20.29 DE = (Dm)c2 we can r
- Page 1878 and 1879:
A Using particle and isotope masses
- Page 1880 and 1881:
smooth curve but exhibits sharp pea
- Page 1882 and 1883:
Nuclear Fission and Fusion First di
- Page 1884 and 1885:
Figure 20.18 Nuclear Fusion In a nu
- Page 1886 and 1887:
DE = (-0.188386 amu)(931 MeV / amu)
- Page 1888 and 1889:
a. 4. a. P91234a ® ?+ b -10 b. R88
- Page 1890 and 1891:
. The formation of lead-206 by alph
- Page 1892 and 1893:
an uncontrolled nuclear chain react
- Page 1894 and 1895:
neutrons, slowing them to increase
- Page 1896 and 1897:
eactor to produce twice as much fis
- Page 1898 and 1899:
or the kidneys, which are almost in
- Page 1900 and 1901:
shown in Figure 20.25 "Using Radiat
- Page 1902 and 1903:
1. Neutron flow is regulated by usi
- Page 1904 and 1905:
some examples are Ru and Ir. You ma
- Page 1906 and 1907:
heavier elements such as carbon and
- Page 1908 and 1909:
concentration of neutrons is so gre
- Page 1910 and 1911:
4. During the lifetime of a star, d
- Page 1912 and 1913:
Neglecting the fission products, wr
- Page 1914 and 1915:
12. 130 W 13. Saylor URL: http://ww
- Page 1916 and 1917:
to lose electrons in chemical react
- Page 1918 and 1919:
C to C bonds are common for carbon,
- Page 1920 and 1921:
c. predict which element differs th
- Page 1922 and 1923:
C O N C E PTUAL P R OBLEMS 1. List
- Page 1924 and 1925:
S T R U C T U R E A N D R E A C T I
- Page 1926 and 1927:
Urey won the Nobel Prize in Chemist
- Page 1928 and 1929:
Because of its 1s 1 electron config
- Page 1930 and 1931:
Hydrogen gas can also be generated
- Page 1932 and 1933:
g. Pd h. Al 6. Which has the higher
- Page 1934 and 1935:
8. Seawater contains 3.5% dissolved
- Page 1936 and 1937:
sulfuric acid to dissolve the desir
- Page 1938 and 1939:
product of reaction with Lithium So
- Page 1940 and 1941:
Equation 21.10 4KO 2 (s) + 2CO 2 (g
- Page 1942 and 1943:
stoichiometry and color of intercal
- Page 1944 and 1945:
"Solutions", crown ethers are cycli
- Page 1946 and 1947:
Figure 21.11 Alkali Metal-Liquid Am
- Page 1948 and 1949:
esponsible for transmitting nerve i
- Page 1950 and 1951:
d. Li 3N(s) + KCl(s) → Given: rea
- Page 1952 and 1953:
to form ionic halides; the heavier
- Page 1954 and 1955:
3. Sodium metal is prepared by elec
- Page 1956 and 1957:
The alkaline earth metals are produ
- Page 1958 and 1959:
One major difference between the gr
- Page 1960 and 1961:
The reaction in Equation 21.27 is t
- Page 1962 and 1963:
Organometallic Compounds Containing
- Page 1964 and 1965:
whereas that of BaCO 3 is almost tw
- Page 1966 and 1967:
must appear in the products, and bo
- Page 1968 and 1969:
1. Beryllium iodide reacts vigorous
- Page 1970 and 1971:
L E A R N I N G O B JE C T I V E 1.
- Page 1972 and 1973:
containing structural materials. No
- Page 1974 and 1975:
Because the health of cells depends
- Page 1976 and 1977:
Summary Covalent hydrides in which
- Page 1978 and 1979:
2. Ultrahigh-purity tritium, which
- Page 1980 and 1981:
cell. The Na + , K + , Mg 2+ , and
- Page 1982 and 1983:
1. To understand the trends in prop
- Page 1984 and 1985:
group 13 elements, only aluminum is
- Page 1986 and 1987:
Property Boron Aluminum* Gallium In
- Page 1988 and 1989:
Unlike metallic solids, elemental b
- Page 1990 and 1991:
(a) The hydrogen-bridged dimer B2H6
- Page 1992 and 1993:
oxidized to H + and O 2 will be red
- Page 1994 and 1995:
in dilute acid, but Al2O3 and Ga2O3
- Page 1996 and 1997:
Because Al is a main group element
- Page 1998 and 1999:
7. Because the B-N unit is isoelect
- Page 2000 and 2001:
d. B 2 H 6 (g) + 2(C 2 H 5 ) 2 S(g)
- Page 2002 and 2003:
d. 16Ga(l) + 3S 8 (s) → 8Ga 2 S 3
- Page 2004 and 2005:
The most common sources of diamonds
- Page 2006 and 2007:
stoichiometry as those of carbon, h
- Page 2008 and 2009:
laboratory, fullerenes have been fo
- Page 2010 and 2011:
temperatures with electropositive m
- Page 2012 and 2013:
Predict the products of the reactio
- Page 2014 and 2015:
Silicon has relatively low-energy,
- Page 2016 and 2017:
The cavities normally contain hydra
- Page 2018 and 2019:
The structure of a linear silicone
- Page 2020 and 2021:
character increases. Silicates cont
- Page 2022 and 2023:
22.3 The Elements of Group 15 (The
- Page 2024 and 2025:
about 0.1% of Earth’s crust, is m
- Page 2026 and 2027:
Note the Pattern Because neutral co
- Page 2028 and 2029:
About 10% of the ammonia produced a
- Page 2030 and 2031:
to handle. A third allotrope of pho
- Page 2032 and 2033:
The heavier pnicogens form sulfides
- Page 2034 and 2035:
states. The stability of the +5 oxi
- Page 2036 and 2037:
A N S W E R S 1. 2. 3. 4. 5. NaNO 2
- Page 2038 and 2039:
photosensitive, selenium is also us
- Page 2040 and 2041:
selenium) have similar properties b
- Page 2042 and 2043:
covalent compounds in which the bon
- Page 2044 and 2045:
Because most of the heavier chalcog
- Page 2046 and 2047:
contain C=S or C=Se bonds and have
- Page 2048 and 2049:
Summary Because the electronegativi
- Page 2050 and 2051:
4. 5. CrO 3 < Al 2 O 3 < Sc 2 O 3 <
- Page 2052 and 2053:
the Cl2 produced annually; organobr
- Page 2054 and 2055:
Oxidative strength decreases down g
- Page 2056 and 2057:
covalent character of the halide du
- Page 2058 and 2059:
a. When the reactants have the same
- Page 2060 and 2061:
2. 3. 4. 5. Ionic character decreas
- Page 2062 and 2063:
was the first of the noble gases to
- Page 2064 and 2065:
Property Helium Neon Argon Krypton
- Page 2066 and 2067:
Xe(g) + 2F 2 (g) → XeF 4 (s) The
- Page 2068 and 2069:
Based on the position of radon in t
- Page 2070 and 2071:
2. Write a balanced chemical equati
- Page 2072 and 2073:
d. the reactivity of elemental C an
- Page 2074 and 2075:
20. Zeolites have become increasing
- Page 2076 and 2077:
Chapter 23 The d-Block Elements Cha
- Page 2078 and 2079:
Because of the lanthanide contracti
- Page 2080 and 2081:
Due to a small increase in successi
- Page 2082 and 2083:
Sc Ti V Cr Mn Fe Co Ni Cu Zn V V V
- Page 2084 and 2085:
Most transition-metal compounds are
- Page 2086 and 2087:
The group 3 metals react with nonme
- Page 2088 and 2089:
Each titanium atom is surrounded by
- Page 2090 and 2091:
molybdenum produced annually is use
- Page 2092 and 2093:
engines. Because tungsten itself ha
- Page 2094 and 2095:
discovered until the 19th century.
- Page 2096 and 2097:
The groups 8-10 metals form a range
- Page 2098 and 2099:
dissolves in the 3:1 HCl:HNO3 mixtu
- Page 2100 and 2101:
Refer to the periodic trends in thi
- Page 2102 and 2103:
adius ratio causes extensive polari
- Page 2104 and 2105:
4. Most of the transition metals ca
- Page 2106 and 2107:
1. 2. 3. 4. 5. 6. 7. 8. 9. Pt 10+ ,
- Page 2108 and 2109:
2FeTiO 3 (s) + 6C(s) + 7Cl 2 (g)
- Page 2110 and 2111:
on sulfuric acid production, see Ch
- Page 2112 and 2113:
Group Element Z Valence Electron Co
- Page 2114 and 2115:
All three group 7 elements have sev
- Page 2116 and 2117:
nickel uses the same alloy. In cont
- Page 2118 and 2119:
old. Copper is almost as ancient, w
- Page 2120 and 2121:
atteries. Large amounts of mercury
- Page 2122 and 2123:
chlorine. The most likely combinati
- Page 2124 and 2125:
group 8 metals in their highest oxi
- Page 2126 and 2127:
9. Pt 10+ , Ir 9+ , and Ni 10+ . Be
- Page 2128 and 2129:
Equation 23.5 PbS s ( ) + O2( g) ®
- Page 2130 and 2131:
WO3( s) +3H2( g)- ® DW ( s) +3H2O(
- Page 2132 and 2133:
2. 3. VCl4 l ( ) +2H 2( g)VCl4( l)
- Page 2134 and 2135:
present. For example, Werner’s da
- Page 2136 and 2137:
MA 4B 2 complexes with each of the
- Page 2138 and 2139:
Coordination Number 2 Although it i
- Page 2140 and 2141:
This coordination number is by far
- Page 2142 and 2143:
ases are hard acids, whereas metal
- Page 2144 and 2145:
Experimentally, it is observed that
- Page 2146 and 2147:
Isomers that contain the same numbe
- Page 2148 and 2149:
Octahedral complexes also exhibit c
- Page 2150 and 2151:
In addition, two structures are pos
- Page 2152 and 2153:
2. Can a tetrahedral MA 2 B 2 compl
- Page 2154 and 2155:
ligands like CO, CFT enables chemis
- Page 2156 and 2157:
(Crystal field splitting energy als
- Page 2158 and 2159:
magnitude of Δo depends on three f
- Page 2160 and 2161:
Note the Pattern The largest Δos a
- Page 2162 and 2163:
spin d 6 complexes, which accounts
- Page 2164 and 2165:
energy is not the same for all five
- Page 2166 and 2167:
D In a high-spin octahedral d 6 com
- Page 2168 and 2169:
line represents the behavior predic
- Page 2170 and 2171:
Figure 23.16 The Jahn-Teller Effect
- Page 2172 and 2173:
Values of the lattice energies for
- Page 2174 and 2175:
4. The ionic radii of V 2+ , Fe 2+
- Page 2176 and 2177:
Consequently, most microorganisms s
- Page 2178 and 2179:
A schematic drawing of the structur
- Page 2180 and 2181:
(−0.20 to −0.50 V) potentials,
- Page 2182 and 2183:
lue copper protein. Moreover, the r
- Page 2184 and 2185:
In a cytochrome c, the heme iron is
- Page 2186 and 2187:
transport system is available to pr
- Page 2188 and 2189:
(a) The Fe 2+ ion in deoxymyoglobin
- Page 2190 and 2191:
electron density is so great that t
- Page 2192 and 2193:
Although hemocyanin and hemerythrin
- Page 2194 and 2195:
The active site of carbonic anhydra
- Page 2196 and 2197:
In the conversion of ethylene glyco
- Page 2198 and 2199:
2. Gout is a painful disorder cause
- Page 2200 and 2201:
these complexes is octahedral; in t
- Page 2202 and 2203:
(carboxylate-bridged copper dimers)
- Page 2204 and 2205:
Figure 24.1 Major Classes of Organi
- Page 2206 and 2207:
positions of groups attached to an
- Page 2208 and 2209:
Figure 24.3 Carbon-Carbon Bonding i
- Page 2210 and 2211:
Figure 24.5 Potential Energy Plot a
- Page 2212 and 2213:
Structural Isomers Unlike conformat
- Page 2214 and 2215:
E X A M P L E 2 Draw all the struct
- Page 2216 and 2217:
superimposed on its mirror image, a
- Page 2218 and 2219:
E X A M P L E 3 Draw the cis and tr
- Page 2220 and 2221:
. 1-methyl-3-chlorocyclopentane Ans
- Page 2222 and 2223:
Although enantiomers have identical
- Page 2224 and 2225:
physical and chemical properties, w
- Page 2226 and 2227:
pregnancy, but unfortunately only t
- Page 2228 and 2229:
A N S W E R S 1. sp 3 ; it is a σ
- Page 2230 and 2231:
a. Draw the structures of the enant
- Page 2232 and 2233:
24.3 Reactivity of Organic Molecule
- Page 2234 and 2235:
Adding one electron to a carbocatio
- Page 2236 and 2237:
c. The (CH 3) 3C + cation contains
- Page 2238 and 2239:
c. (CH 3 ) 3 N + BCl 3 → 24.4 Com
- Page 2240 and 2241:
Some reactions involve the removal,
- Page 2242 and 2243:
Equation 24.6 Br ×+ Br ×CH 3CH 2
- Page 2244 and 2245:
a. The CN − ion of KCN is a poten
- Page 2246 and 2247:
2. Sketch the mechanism for the nuc
- Page 2248 and 2249:
the solid state. It is therefore se
- Page 2250 and 2251:
Saylor URL: http://www.saylor.org/b
- Page 2252 and 2253:
Alkenes and alkynes are most often
- Page 2254 and 2255:
carbocation formed in the first ste
- Page 2256 and 2257:
Oxygen- and Nitrogen-Containing Fun
- Page 2258 and 2259:
In compounds containing a carbonyl
- Page 2260 and 2261:
Containing Functional Groups"), and
- Page 2262 and 2263:
Compounds that contain the carboxyl
- Page 2264 and 2265:
protonate the doubly bonded oxygen
- Page 2266 and 2267:
the two substituents on the amide n
- Page 2268 and 2269:
onded to one hydrogen and two alkyl
- Page 2270 and 2271:
Given: reactants Asked for: product
- Page 2272 and 2273:
substitution reaction. Alcohols und
- Page 2274 and 2275:
A N S W E R S 1. 2. 3. 4. 5. (c) an
- Page 2276 and 2277:
1. To understand the general proper
- Page 2278 and 2279:
In contrast, the radicals formed du
- Page 2280 and 2281:
Alkenes and alkynes are most often
- Page 2282 and 2283:
The carbocation formed in the first
- Page 2284 and 2285:
contain the carbonyl functional gro
- Page 2286 and 2287:
Figure 24.17 Some Familiar Aldehyde
- Page 2288 and 2289:
Containing Functional Groups"), and
- Page 2290 and 2291:
Compounds that contain the carboxyl
- Page 2292 and 2293:
protonate the doubly bonded oxygen
- Page 2294 and 2295:
the two substituents on the amide n
- Page 2296 and 2297:
molecular masses. Primary amines te
- Page 2298 and 2299:
Solution: a. The proton on the carb
- Page 2300 and 2301:
density. An alcohol is often prepar
- Page 2302 and 2303:
15. What factors determine the reac
- Page 2304 and 2305:
24.6 The Molecules of Life L E A R
- Page 2306 and 2307:
In solution, simple sugars exist pr
- Page 2308 and 2309:
Because carbohydrates have a carbon
- Page 2310 and 2311:
Given: Fischer projection of a suga
- Page 2312 and 2313:
The double bonds of unsaturated fat
- Page 2314 and 2315:
Nucleic Acids Nucleic acids are the
- Page 2316 and 2317:
untreated, it produces severe brain
- Page 2318 and 2319:
2. Cyclohexanecarboxylic acid is a
- Page 2320 and 2321:
Both glyceraldehyde and glyceric ac
- Page 2322 and 2323:
1. The first staggered conformation
- Page 2324 and 2325:
Substance ΔHf° (kJ/mol) ΔGf° (k
- Page 2326 and 2327:
Substance ΔHf° (kJ/mol) ΔGf° (k
- Page 2328 and 2329:
Substance ΔHf° (kJ/mol) ΔGf° (k
- Page 2330 and 2331:
Substance ΔHf° (kJ/mol) ΔGf° (k
- Page 2332 and 2333:
Substance ΔHf° (kJ/mol) ΔGf° (k
- Page 2334 and 2335:
Substance ΔHf° (kJ/mol) ΔGf° (k
- Page 2336 and 2337:
Compound Name Compound Formula K sp
- Page 2338 and 2339:
Compound Name Compound Formula K sp
- Page 2340 and 2341:
Name Formula K a1 pKa1 K a2 pKa2 K
- Page 2342 and 2343:
Chapter 27 Appendix C: Dissociation
- Page 2344 and 2345:
Name Formula K a1 pKa1 K a2 pKa2 K
- Page 2346 and 2347:
Chapter 29 Appendix E: Standard Red
- Page 2348 and 2349:
Half-Reaction E° (V) Cu 2+ + 2e
- Page 2350 and 2351:
Half-Reaction E° (V) Nd 3+ + 3e
- Page 2352 and 2353:
Half-Reaction E° (V) U 3+ + 3e −
- Page 2354 and 2355:
10 1.2281 40 7.3814 70 31.176 100 1
- Page 2356 and 2357:
Chapter 32 Appendix H: Periodic Tab
- Page 2358 and 2359:
List of Elements Name Symbol Atomic
- Page 2360 and 2361:
List of Elements Name Symbol Atomic
- Page 2362 and 2363:
Chapter 33 Appendix I: Experimental
- Page 2364 and 2365:
Chapter 34 Art Credits 34.1 Molecul
Inappropriate
Loading...
Inappropriate
You have already flagged this document.
Thank you, for helping us keep this platform clean.
The editors will have a look at it as soon as possible.
Mail this publication
Loading...
Embed
Loading...
Delete template?
Are you sure you want to delete your template?
DOWNLOAD ePAPER
This ePaper is currently not available for download.
You can find similar magazines on this topic below under ‘Recommendations’.