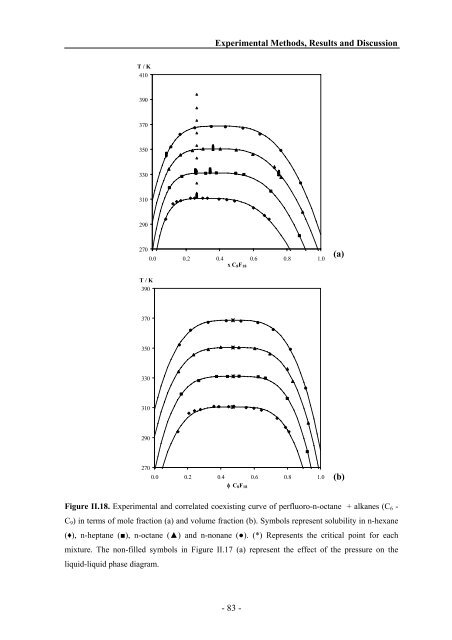
T / K 410 390 370 350 330 310 290 270 T / K 390 370 350 330 310 290 270 Experimental Methods, Results <strong>and</strong> Discussion 0.0 0.2 0.4 0.6 0.8 1.0 x C8F18 0.0 0.2 0.4 0.6 0.8 1.0 φ C8F18 Figure II.18. Experimental <strong>and</strong> correlated coexisting curve of perfluoro-n-octane + alkanes (C6 - C9) in terms of mole fraction (a) <strong>and</strong> volume fraction (b). Symbols represent solubility in n-hexane (♦), n-heptane (■), n-octane (▲) <strong>and</strong> n-nonane (●). (*) Represents the critical point for each mixture. The non-filled symbols in Figure II.17 (a) represent the effect of the pressure on the liquid-liquid phase diagram. - 83 - (a) (b)
References Experimental Methods, Results <strong>and</strong> Discussion Abedi, S.J.; Cai, H.-Y.; Seyfaie, S.; Shaw, J.M., Simultaneous Phase Behaviour, Elemental Composition <strong>and</strong> Density Measurement Using X-ray Imaging, Fluid Phase Equilibria (1999) 158–160: 775 Albert H. J.; Wood, R. H., High-Precision Flow Densimeter for Fluids at Temperatures to 700 K <strong>and</strong> Pressures to 40 MPa, Rev. Sci. Instrum. (1984) 55: 589 Ambrose D., Reference Values of Vapour Pressure. The Vapour Pressure of Benzene <strong>and</strong> Hexafluorobenzene, J. Chem. <strong>Thermodynamics</strong> (1981) 13: 1161 Ambrose, D.; Ewing, M. B.; Ghiasse, N. B.; Ochoa, J. C. Sanchez, J. Chem. <strong>Thermodynamics</strong> (1990) 22: 589 Ambrose, D.; Ellender, J. H. The Vapour Pressure of Octafluorotoluene, J. Chem. <strong>Thermodynamics</strong> (1981) 13: 901 Barton, A. F. M., CRC H<strong>and</strong>book of Solubility Parameters <strong>and</strong> Other Cohesion Parameters, (1991) 2 nd Edition, CRC Press Battino, R.; Clever, H.L., The Solubility of Gases in Liquids, Chem. Rev. (1966) 66: 395 Battino, R.; Wilcock, R.; Wilhelm, E., Low-Pressure Solubility of Gases in Liquid Water, Chem. Rev. (1977) 77: 219 Battino, R., The Ostwald Coefficient of Gas Solubility, Fluid Phase Equilibria (1984) 15: 231 Bauer, N.; Lewin, S. Z., Determination of Density, in Weissberger A. ed. (1972) Bedford, R. G.; Dunlap, R. D., Solubilities <strong>and</strong> Volume Changes Attending Mixing for the System: Perfluoro-n-hexane-n-hexane, J. Am. Chem. Soc. (1958) 80: 282 Ben Naim, A.; Baer, S. Method for Measuring Solubilities of Slightly Soluble Gases in Liquids Trans. Faraday Soc. (1963) 59: 2735 Ben Naim, A. Hydrophobic Interactions, Plenum Press, New York (1980) Ben Naim, A. Marcus, Y. Solvation <strong>Thermodynamics</strong> of Nonionic Solutes, J. Chem. Phys. (1984) 81: 2016 Ben Naim, A. On the Evolution of the Concept of Solvation <strong>Thermodynamics</strong>, J. of Solution Chem. (2001) 30: 475 Benning, A. F.; Park, J.D., U. S. Patent 2, (1949) 490, 764 - 84 -
- Page 1 and 2:
Ana Maria Antunes Dias Universidade
- Page 3 and 4:
o júri presidente Prof. Dr. Joaqui
- Page 5 and 6:
palavras-chave resumo perfluoroalca
- Page 7 and 8:
Contents Notation List of Tables Li
- Page 9 and 10:
Notation Abbreviations AAD EoS LCST
- Page 11 and 12:
List of Tables Table I.1 Average Bo
- Page 13 and 14:
Table III.6 Adjusted Binary Paramet
- Page 15 and 16:
Figure II.9 Comparison between corr
- Page 17 and 18:
Figure III.8 Temperature-density di
- Page 19 and 20:
Figure III.25 Vapor-phase mole frac
- Page 21 and 22:
I.1. Fluorine Properties General In
- Page 23 and 24:
Table I.2. Physicochemical Properti
- Page 25 and 26:
General Introduction order to compa
- Page 27 and 28:
General Introduction the numerous a
- Page 29 and 30:
General Introduction carbon dioxide
- Page 31 and 32:
General Introduction animals. That
- Page 33 and 34:
General Introduction Table I.3. Lit
- Page 35 and 36:
References General Introduction Ban
- Page 37 and 38:
General Introduction Hildebrand, J.
- Page 39 and 40:
General Introduction Rowinsky EK. N
- Page 41 and 42:
II. Part EXPERIMENTAL METHODS, RESU
- Page 43 and 44:
Experimental Methods, Results and D
- Page 45 and 46:
Experimental Methods, Results and D
- Page 47 and 48:
Experimental Methods, Results and D
- Page 49 and 50:
Table II.3. (continued) T K ρexp g
- Page 51 and 52: ρ / g.cm-3 1.750 1.730 1.710 1.690
- Page 53 and 54: Experimental Methods, Results and D
- Page 55 and 56: I. 3. Vapour pressure I.3.1. Biblio
- Page 57 and 58: I.3.2. Apparatus and Procedure Expe
- Page 59 and 60: I.3.3. Experimental Results and Dis
- Page 61 and 62: Experimental Methods, Results and D
- Page 63 and 64: Table II.8. (continued) T K Pexp kP
- Page 65 and 66: Experimental Methods, Results and D
- Page 67 and 68: ΔH vap = TΔS vap 2⎛ d ln P ⎞
- Page 69 and 70: I.4. Solubility at atmospheric pres
- Page 71 and 72: Experimental Methods, Results and D
- Page 73 and 74: Experimental Methods, Results and D
- Page 75 and 76: Experimental Methods, Results and D
- Page 77 and 78: Experimental Methods, Results and D
- Page 79 and 80: x2 (T,P2) 7.0E-03 6.0E-03 5.0E-03 4
- Page 81 and 82: L 2,1 0.70 0.60 0.50 0.40 0.30 285
- Page 83 and 84: Experimental Methods, Results and D
- Page 85 and 86: Experimental Methods, Results and D
- Page 87 and 88: Experimental Methods, Results and D
- Page 89 and 90: Experimental Methods, Results and D
- Page 91 and 92: Experimental Methods, Results and D
- Page 93 and 94: P / MPa 6 5 4 3 2 1 0 P / MPa 14 12
- Page 95 and 96: II.6. Liquid - Liquid Equilibrium I
- Page 97 and 98: Experimental Methods, Results and D
- Page 99 and 100: Experimental Methods, Results and D
- Page 101: 0 τ β Δ1 2Δ1 [ 1+ B τ + B τ +
- Page 105 and 106: Experimental Methods, Results and D
- Page 107 and 108: Experimental Methods, Results and D
- Page 109 and 110: Experimental Methods, Results and D
- Page 111 and 112: III.1. Introduction Modeling Most c
- Page 113 and 114: Modeling The pioneering work of Wer
- Page 115 and 116: III.2. Soft-SAFT Model Modeling A S
- Page 117 and 118: Modeling The equation of state is w
- Page 119 and 120: Chain Term Modeling Originally Wert
- Page 121 and 122: Modeling The model is easily extend
- Page 123 and 124: ( ) ( ) ∑∑∑ 3 2 2 2 2 qq 32π
- Page 125 and 126: Modeling HRT is a promising theory,
- Page 127 and 128: ( ρ) ρ , 0 ≤ ρ ( ρ) 2 Modelin
- Page 129 and 130: III.3. Application to Pure Compound
- Page 131 and 132: Modeling From the optimised paramet
- Page 133 and 134: T / K 400 350 300 250 200 150 100 5
- Page 135 and 136: ln Pvap 1.0E+01 1.0E+00 1.0E-01 1.0
- Page 137 and 138: Modeling Table III.2. Absolute Aver
- Page 139 and 140: Modeling The correlation coefficien
- Page 141 and 142: Pvap (MPa) 4.00 3.50 3.00 2.50 2.00
- Page 143 and 144: Modeling The mixture parameters a a
- Page 145 and 146: Modeling the assumptions made by th
- Page 147 and 148: Modeling between oxygen and perfluo
- Page 149 and 150: xSolute 5.5E-03 5.0E-03 4.5E-03 4.0
- Page 151 and 152: Modeling previous work, dealing wit
- Page 153 and 154:
Modeling These results confirm that
- Page 155 and 156:
Modeling CO2 binary mixtures using
- Page 157 and 158:
Modeling average deviation (AAD) be
- Page 159 and 160:
P / MPa 14 12 10 8 6 4 2 0 0 0.2 0.
- Page 161 and 162:
Modeling Figures III.16, III.17 and
- Page 163 and 164:
Modeling calculations from the orig
- Page 165 and 166:
Table III.9. References for VLE exp
- Page 167 and 168:
P / MPa 20 18 16 14 12 10 8 6 4 2 0
- Page 169 and 170:
Modeling Finally, Figure III.24 pre
- Page 171 and 172:
III.4.4. VLE and LLE of Alkane and
- Page 173 and 174:
Modeling number of perfluro-n-alkan
- Page 175 and 176:
y C6F14 1.0 0.8 0.6 0.4 0.2 0.0 0.0
- Page 177 and 178:
P / MPa 0.08 0.07 0.06 0.05 0.04 0.
- Page 179 and 180:
P / MPa 0.12 0.10 0.08 0.06 0.04 0.
- Page 181 and 182:
Modeling approach based on the meth
- Page 183 and 184:
Modeling Blas, F. J.; Vega, L. F.,
- Page 185 and 186:
DIPPR, Thermophysical Properties Da
- Page 187 and 188:
Modeling Hildebrand, J. H.; Fisher,
- Page 189 and 190:
Modeling McCabe, C.; Jackson, SAFT-
- Page 191 and 192:
Modeling Poling, B.; Prauznitz, J.;
- Page 193 and 194:
Modeling Wertheim, M. S., Fluids wi