n - PATh :.: Process and Product Applied Thermodynamics research ...
n - PATh :.: Process and Product Applied Thermodynamics research ...
n - PATh :.: Process and Product Applied Thermodynamics research ...

Create successful ePaper yourself
Turn your PDF publications into a flip-book with our unique Google optimized e-Paper software.
Experimental Methods, Results <strong>and</strong> Discussion<br />
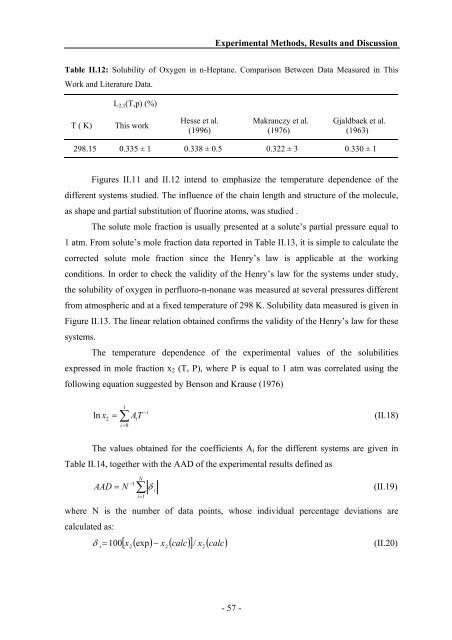
Table II.12: Solubility of Oxygen in n-Heptane. Comparison Between Data Measured in This<br />
Work <strong>and</strong> Literature Data.<br />
L2,1(T,p) (%)<br />
T ( K) This work<br />
Hesse et al.<br />
(1996)<br />
Makranczy et al.<br />
(1976)<br />
Gjaldbaek et al.<br />
(1963)<br />
298.15 0.335 ± 1 0.338 ± 0.5 0.322 ± 3 0.330 ± 1<br />
Figures II.11 <strong>and</strong> II.12 intend to emphasize the temperature dependence of the<br />
different systems studied. The influence of the chain length <strong>and</strong> structure of the molecule,<br />
as shape <strong>and</strong> partial substitution of fluorine atoms, was studied .<br />
The solute mole fraction is usually presented at a solute’s partial pressure equal to<br />
1 atm. From solute’s mole fraction data reported in Table II.13, it is simple to calculate the<br />
corrected solute mole fraction since the Henry’s law is applicable at the working<br />
conditions. In order to check the validity of the Henry’s law for the systems under study,<br />
the solubility of oxygen in perfluoro-n-nonane was measured at several pressures different<br />
from atmospheric <strong>and</strong> at a fixed temperature of 298 K. Solubility data measured is given in<br />
Figure II.13. The linear relation obtained confirms the validity of the Henry’s law for these<br />
systems.<br />
The temperature dependence of the experimental values of the solubilities<br />
expressed in mole fraction x2 (T, P), where P is equal to 1 atm was correlated using the<br />
following equation suggested by Benson <strong>and</strong> Krause (1976)<br />
1<br />
−i<br />
ln x2<br />
= ∑ AiT<br />
(II.18)<br />
i=<br />
0<br />
The values obtained for the coefficients Ai for the different systems are given in<br />
Table II.14, together with the AAD of the experimental results defined as<br />
AAD = N<br />
N<br />
−1<br />
∑<br />
i=<br />
1<br />
δ (II.19)<br />
i<br />
where N is the number of data points, whose individual percentage deviations are<br />
calculated as:<br />
[ x ( exp)<br />
x ( calc)<br />
] / x ( calc)<br />
δ = 100 −<br />
(II.20)<br />
i 2<br />
2<br />
2<br />
- 57 -