IC Companys â Annual Report 2008/09 0 - IC Companys A/S
IC Companys â Annual Report 2008/09 0 - IC Companys A/S
IC Companys â Annual Report 2008/09 0 - IC Companys A/S
You also want an ePaper? Increase the reach of your titles
YUMPU automatically turns print PDFs into web optimized ePapers that Google loves.
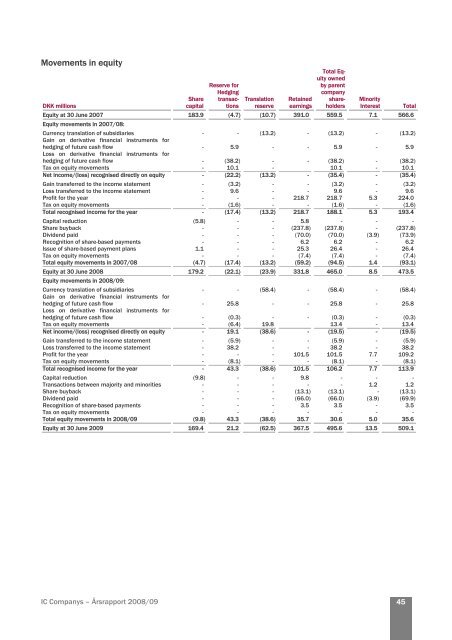
Movements in equity<br />
DKK millions<br />
Share<br />
capital<br />
Reserve for<br />
Hedging<br />
transactions<br />
Translation<br />
reserve<br />
Retained<br />
earnings<br />
Total Equity<br />
owned<br />
by parent<br />
company<br />
shareholders<br />
Minority<br />
Interest Total<br />
Equity at 30 June 2007 183.9 (4.7) (10.7) 391.0 559.5 7.1 566.6<br />
Equity movements in 2007/08:<br />
Currency translation of subsidiaries - - (13.2) - (13.2) - (13.2)<br />
Gain on derivative financial instruments for<br />
hedging of future cash flow<br />
Loss on derivative financial instruments for<br />
- 5.9 - - 5.9 - 5.9<br />
hedging of future cash flow<br />
- (38.2) - - (38.2) - (38.2)<br />
Tax on equity movements - 10.1 - 10.1 - 10.1<br />
Net income/(loss) recognised directly on equity - (22.2) (13.2) - (35.4) - (35.4)<br />
Gain transferred to the income statement - (3.2) - - (3.2) - (3.2)<br />
Loss transferred to the income statement - 9.6 - - 9.6 - 9.6<br />
Profit for the year - - - 218.7 218.7 5.3 224.0<br />
Tax on equity movements - (1.6) - - (1.6) - (1.6)<br />
Total recognised income for the year - (17.4) (13.2) 218.7 188.1 5.3 193.4<br />
Capital reduction (5.8) - - 5.8 - - -<br />
Share buyback - - - (237.8) (237.8) - (237.8)<br />
Dividend paid - - - (70.0) (70.0) (3.9) (73.9)<br />
Recognition of share-based payments - - - 6.2 6.2 - 6.2<br />
Issue of share-based payment plans 1.1 - - 25.3 26.4 - 26.4<br />
Tax on equity movements - - - (7.4) (7.4) - (7.4)<br />
Total equity movements in 2007/08 (4.7) (17.4) (13.2) (59.2) (94.5) 1.4 (93.1)<br />
Equity at 30 June <strong>2008</strong> 179.2 (22.1) (23.9) 331.8 465.0 8.5 473.5<br />
Equity movements in <strong>2008</strong>/<strong>09</strong>:<br />
Currency translation of subsidiaries - - (58.4) - (58.4) - (58.4)<br />
Gain on derivative financial instruments for<br />
hedging of future cash flow<br />
Loss on derivative financial instruments for<br />
- 25.8 - - 25.8 - 25.8<br />
hedging of future cash flow<br />
- (0.3) - - (0.3) - (0.3)<br />
Tax on equity movements - (6.4) 19.8 13.4 - 13.4<br />
Net income/(loss) recognised directly on equity - 19.1 (38.6) - (19.5) - (19.5)<br />
Gain transferred to the income statement - (5.9) - - (5.9) - (5.9)<br />
Loss transferred to the income statement - 38.2 - - 38.2 - 38.2<br />
Profit for the year - - - 101.5 101.5 7.7 1<strong>09</strong>.2<br />
Tax on equity movements - (8.1) - - (8.1) - (8.1)<br />
Total recognised income for the year - 43.3 (38.6) 101.5 106.2 7.7 113.9<br />
Capital reduction (9.8) - - 9.8 - - -<br />
Transactions between majority and minorities - - - - - 1.2 1.2<br />
Share buyback - - - (13.1) (13.1) - (13.1)<br />
Dividend paid - - - (66.0) (66.0) (3.9) (69.9)<br />
Recognition of share-based payments - - - 3.5 3.5 - 3.5<br />
Tax on equity movements - - - - - - -<br />
Total equity movements in <strong>2008</strong>/<strong>09</strong> (9.8) 43.3 (38.6) 35.7 30.6 5.0 35.6<br />
Equity at 30 June 20<strong>09</strong> 169.4 21.2 (62.5) 367.5 495.6 13.5 5<strong>09</strong>.1<br />
<strong>IC</strong> <strong>Companys</strong> – Årsrapport <strong>2008</strong>/<strong>09</strong><br />
45


