IC Companys â Annual Report 2008/09 0 - IC Companys A/S
IC Companys â Annual Report 2008/09 0 - IC Companys A/S
IC Companys â Annual Report 2008/09 0 - IC Companys A/S

Create successful ePaper yourself
Turn your PDF publications into a flip-book with our unique Google optimized e-Paper software.
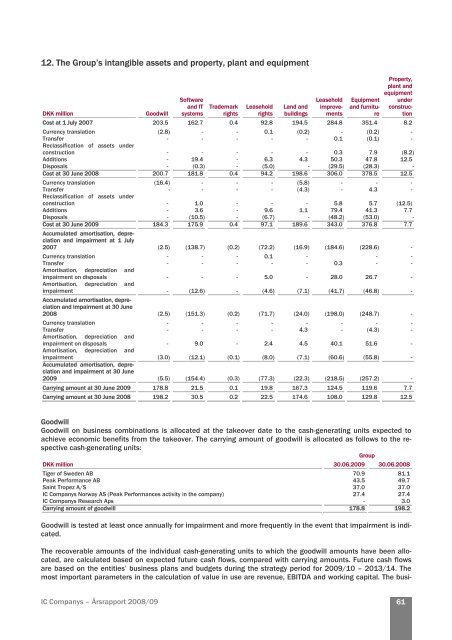
12. The Group’s intangible assets and property, plant and equipment<br />
DKK million Goodwill<br />
Software<br />
and IT<br />
systems<br />
Trademark<br />
rights<br />
Leasehold<br />
rights<br />
Land and<br />
buildings<br />
Leasehold<br />
improvements<br />
Equipment<br />
and furniture<br />
Property,<br />
plant and<br />
equipment<br />
under<br />
construction<br />
Cost at 1 July 2007 203.5 162.7 0.4 92.8 194.5 284.8 351.4 8.2<br />
Currency translation (2.8) - - 0.1 (0.2) - (0.2) -<br />
Transfer<br />
Reclassification of assets under<br />
- - - - - 0.1 (0.1) -<br />
construction<br />
-<br />
-<br />
-<br />
-<br />
-<br />
0.3<br />
7.9 (8.2)<br />
Additions - 19.4 - 6.3 4.3 50.3 47.8 12.5<br />
Disposals - (0.3) - (5.0) - (29.5) (28.3) -<br />
Cost at 30 June <strong>2008</strong> 200.7 181.8 0.4 94.2 198.6 306.0 378.5 12.5<br />
Currency translation (16.4) - - - (5.8) - - -<br />
Transfer<br />
Reclassification of assets under<br />
- - - - (4.3) - 4.3<br />
-<br />
construction<br />
- 1.0 - - - 5.8 5.7 (12.5)<br />
Additions - 3.6 - 9.6 1.1 79.4 41.3 7.7<br />
Disposals - (10.5) - (6.7) - (48.2) (53.0) -<br />
Cost at 30 June 20<strong>09</strong> 184.3 175.9 0.4 97.1 189.6 343.0 376.8 7.7<br />
Accumulated amortisation, depreciation<br />
and impairment at 1 July<br />
2007<br />
(2.5) (138.7) (0.2)<br />
(72.2) (16.9) (184.6)<br />
(228.6)<br />
Currency translation - - - 0.1 - - -<br />
Transfer - - - - - 0.3 - -<br />
Amortisation, depreciation and<br />
impairment on disposals<br />
Amortisation, depreciation and<br />
impairment<br />
Accumulated amortisation, depreciation<br />
and impairment at 30 June<br />
<strong>2008</strong><br />
-<br />
-<br />
-<br />
5.0<br />
- (12.6) - (4.6) (7.1) (41.7) (46.8) -<br />
(2.5) (151.3) (0.2)<br />
-<br />
28.0<br />
(71.7) (24.0) (198.0)<br />
26.7<br />
(248.7)<br />
Currency translation - - - - - - -<br />
-<br />
Transfer - - - - 4.3 - (4.3)<br />
-<br />
Amortisation, depreciation and<br />
impairment on disposals<br />
- 9.0<br />
- 2.4 4.5 40.1 51.6<br />
-<br />
Amortisation, depreciation and<br />
impairment<br />
Accumulated amortisation, depreciation<br />
and impairment at 30 June<br />
(3.0) (12.1) (0.1) (8.0) (7.1) (60.6) (55.8) -<br />
20<strong>09</strong><br />
(5.5) (154.4) (0.3) (77.3) (22.3) (218.5) (257.2) -<br />
Carrying amount at 30 June 20<strong>09</strong> 178.8 21.5 0.1 19.8 167.3 124.5 119.6 7.7<br />
Carrying amount at 30 June <strong>2008</strong> 198.2 30.5 0.2 22.5 174.6 108.0 129.8 12.5<br />
Goodwill<br />
Goodwill on business combinations is allocated at the takeover date to the cash-generating units expected to<br />
achieve economic benefits from the takeover. The carrying amount of goodwill is allocated as follows to the respective<br />
cash-generating units:<br />
Group<br />
DKK million 30.06.20<strong>09</strong> 30.06.<strong>2008</strong><br />
Tiger of Sweden AB 70.9 81.1<br />
Peak Performance AB 43.5 49.7<br />
Saint Tropez A/S 37.0 37.0<br />
<strong>IC</strong> <strong>Companys</strong> Norway AS (Peak Performances activity in the company) 27.4 27.4<br />
<strong>IC</strong> <strong>Companys</strong> Research Aps - 3.0<br />
Carrying amount of goodwill 178.8 198.2<br />
Goodwill is tested at least once annually for impairment and more frequently in the event that impairment is indicated.<br />
The recoverable amounts of the individual cash-generating units to which the goodwill amounts have been allocated,<br />
are calculated based on expected future cash flows, compared with carrying amounts. Future cash flows<br />
are based on the entities’ business plans and budgets during the strategy period for 20<strong>09</strong>/10 – 2013/14. The<br />
most important parameters in the calculation of value in use are revenue, EBITDA and working capital. The busi-<br />
<strong>IC</strong> <strong>Companys</strong> – Årsrapport <strong>2008</strong>/<strong>09</strong><br />
61<br />
-<br />
-<br />
-