- Page 1:
Marianne Heiberg and Geir Øvensen
- Page 4 and 5:
© Fagbevegelsens senter for forskn
- Page 6 and 7:
Chapter 4 Health ..................
- Page 8 and 9:
Preface The history of the FAFO liv
- Page 10 and 11:
future analyses. We look forward to
- Page 12 and 13:
Gaza, colonel Zacharias Backer, gav
- Page 14 and 15:
tive effects of economic growth, su
- Page 16 and 17:
Demographics: The size and composit
- Page 18 and 19:
cally different. For example, Israe
- Page 20 and 21:
Interested readers should consult t
- Page 22 and 23:
of ten look at their situation in m
- Page 24 and 25:
The Fragmentation of Palestinian So
- Page 26 and 27:
dunums would be used for subsistenc
- Page 28 and 29:
Whole village communities, as well
- Page 30 and 31:
planning, the transfer of land acqu
- Page 32 and 33:
eginning of 1993. It continues to a
- Page 34 and 35:
4 The data in this section is deri
- Page 37 and 38:
Chapter 2 Population Characteristic
- Page 39 and 40:
British Mandate of Palestine as its
- Page 41 and 42:
Table 2.1 Head of household'sfather
- Page 43 and 44:
Gaza West Bank centers which remain
- Page 45 and 46:
In the present study the Gaza Strip
- Page 47 and 48:
egional pyramids can be compared to
- Page 49 and 50:
West Bank variations by refugee sta
- Page 51 and 52:
Infant and Child Mortality The rest
- Page 53 and 54:
ever bom (CEB) and children survivi
- Page 55 and 56:
Age Structure The data set represen
- Page 57 and 58:
fallirig outside this interval may
- Page 59 and 60:
second and the third groups with we
- Page 61 and 62:
q(S) durmg the last fIfteen years,
- Page 63 and 64:
Concluding Remarks The Brass method
- Page 65 and 66:
50 years at the time of the intervi
- Page 67 and 68:
in the value for the age group 25-2
- Page 69 and 70:
The projections are based on extens
- Page 71 and 72:
Mortality u sing F ALCOT 92 results
- Page 73 and 74:
Table 2.15 Assumed age structure of
- Page 75 and 76:
distribution in three broad age gro
- Page 77 and 78:
64. The weakest growth is expected
- Page 79 and 80:
Shahin et al. (1989), A Baseline De
- Page 81 and 82:
17 Statistical abstract of Israel 1
- Page 83 and 84:
Chapter 3 Housing Marianne Heiberg
- Page 85 and 86:
ecome underdeveloped due to c1osure
- Page 87 and 88:
Table 3.4 Mean squnre meters per ho
- Page 89 and 90:
ed households. The survey figures f
- Page 91 and 92:
With regard to heating, in Arab Jer
- Page 93 and 94:
shift, reflecting increased prosper
- Page 95 and 96:
Survey data on fonns of ownership i
- Page 97 and 98:
injured, the fewest injuries occurr
- Page 99:
Gaza camps and West Bank camps woul
- Page 102 and 103:
All individuals in the sample were
- Page 104 and 105:
14 days. The survey included childr
- Page 106 and 107:
oth of which are characterized by a
- Page 108 and 109:
Variations in Rates and Patterns of
- Page 110 and 111:
The rate of acute and chronic illne
- Page 112 and 113:
tive of social background. Religios
- Page 114 and 115:
in Sweden, and 7.4 in Belgium and 1
- Page 116 and 117:
provide family planning assistance.
- Page 118 and 119:
given assistance in private cIinics
- Page 120 and 121:
up to 44% among those above 60 year
- Page 122 and 123:
Protective Factors Stress tolerance
- Page 124 and 125:
on the frequencies and distribu- Ta
- Page 126 and 127:
high degree of distress increases o
- Page 128 and 129:
About I out of 3 respond- Table 4.1
- Page 130 and 131:
The second question needs further a
- Page 132 and 133:
References Feachem RGA. et al. The
- Page 134 and 135:
education to the world outside laea
- Page 136 and 137:
in a subsequent chapter which deals
- Page 138 and 139:
y literacy, but is not the equivale
- Page 140 and 141:
It is widely believed that UNRWA an
- Page 142 and 143:
Reversely, for those in the bot- Ta
- Page 144 and 145:
Religious observance is affected by
- Page 146 and 147:
life - the family, the neighbourhoo
- Page 148 and 149:
For men and women there seems to be
- Page 150 and 151:
The increased propensity, associate
- Page 152 and 153:
determine whether or not women are
- Page 154 and 155:
wear Western forms of dress (table
- Page 156 and 157:
tributes of gen der and age in affe
- Page 158 and 159:
political institutions recognized b
- Page 160 and 161:
The lower the level of a household'
- Page 162 and 163:
In contrast to most developing coun
- Page 164 and 165:
Religious affiliation was considere
- Page 166 and 167:
etween household weaIth and Head of
- Page 168 and 169:
Recent Development of Household Inc
- Page 170 and 171:
Figure 6.9 shows thatchanges in hou
- Page 172 and 173:
In Arab Jerusalem, one out of five
- Page 174 and 175:
income as their only type of in com
- Page 176 and 177:
survey. Capital income in the occup
- Page 178 and 179:
e said roughly to be associated wit
- Page 180 and 181:
As to recentdevelopments in househo
- Page 182 and 183:
180
- Page 184 and 185:
Labour Force Definitions For measur
- Page 186 and 187:
countries. Casual work, unpaid work
- Page 188 and 189:
to some extent may be explained by
- Page 190 and 191:
tive economic acti vities has been
- Page 192 and 193:
The firsteffect(whichresembles Figu
- Page 194 and 195:
employment. Invisible underemployme
- Page 196 and 197:
hold full-time jobs. Figure 7.9 iII
- Page 198 and 199:
older and weU educated persons than
- Page 200 and 201:
entry into Israel. 2) Cultural fact
- Page 202 and 203:
workers having had only one job dro
- Page 204 and 205:
Figure 7.20 shows that the north- F
- Page 206 and 207:
tendency to the opposite effect. Mo
- Page 208 and 209:
occupied territories employed in Is
- Page 210 and 211:
) "activities which do not generate
- Page 212 and 213:
tus, and the relatively high rate o
- Page 214 and 215:
In conclusion, when engaging in inc
- Page 216 and 217:
the total economy' s production of
- Page 218 and 219:
where income appears at the timeof
- Page 220 and 221:
48 There is no correlation between
- Page 222 and 223:
220
- Page 224 and 225:
There is, however, little common ag
- Page 226 and 227:
occupational prestige categories, o
- Page 228 and 229:
opposed to the status categorizatio
- Page 230 and 231:
The distribution is grouped into fo
- Page 232 and 233:
of their male counterparts, and may
- Page 234 and 235:
access to financial support (e.g. N
- Page 236 and 237:
economic trends, invoking il greate
- Page 238 and 239:
taken individually, dose to half of
- Page 240 and 241:
The Role of the Family Based on the
- Page 242 and 243:
etween the two extreme categories o
- Page 244 and 245:
can be observed. With the emergence
- Page 246 and 247:
etween different social groups with
- Page 248 and 249:
ackground characteristics. All coef
- Page 250 and 251:
248
- Page 252 and 253:
eal views in a formally constructed
- Page 254 and 255:
These points are further illustrate
- Page 256 and 257:
girls far below the age of puberty
- Page 258 and 259:
to each other, but the social messa
- Page 260 and 261:
played out in the work plaee, an ar
- Page 262 and 263:
efugees, regardless of whether they
- Page 264 and 265:
Education also seems to impact on t
- Page 266 and 267:
While disparities in religious Tabl
- Page 268 and 269:
Political Attitudes Because politic
- Page 270 and 271:
Islam might be less, survey results
- Page 272 and 273:
the trend toward increasing prefere
- Page 274 and 275:
premise is that the individual owes
- Page 276 and 277:
women seems not to be affected by a
- Page 278 and 279:
occupied territories into advanced
- Page 280 and 281: The single most embittered sector o
- Page 282 and 283: answer" category is higher since ma
- Page 284 and 285: generation, Palestinian society als
- Page 286 and 287: frarne. Within the questionnaire, m
- Page 288 and 289: ideology that refuses to recognize
- Page 290 and 291: divoreed. On the other hand, 7% of
- Page 292 and 293: 64 women at ages 43-47. These facto
- Page 294 and 295: Preferred Marriage Age As mentioned
- Page 296 and 297: Here it becomes dear that Table lO.
- Page 298 and 299: to seIl. Because of a low sample si
- Page 300 and 301: differences: the differences in jew
- Page 302 and 303: high numbers of young Table 10.13 C
- Page 304 and 305: within, between and outside of thei
- Page 306 and 307: Another interesting point in Table
- Page 308 and 309: association with the tradition of i
- Page 310 and 311: and, in the West Bank, the strong d
- Page 312 and 313: professional work. In other words,
- Page 314 and 315: 312
- Page 316 and 317: would be involved, this was conside
- Page 318 and 319: the various sampling stages Table A
- Page 320 and 321: that this particular feature might
- Page 322 and 323: Multi-household housing units frequ
- Page 324 and 325: Sample Allocation In this section t
- Page 326 and 327: i.e. the sum of sample households o
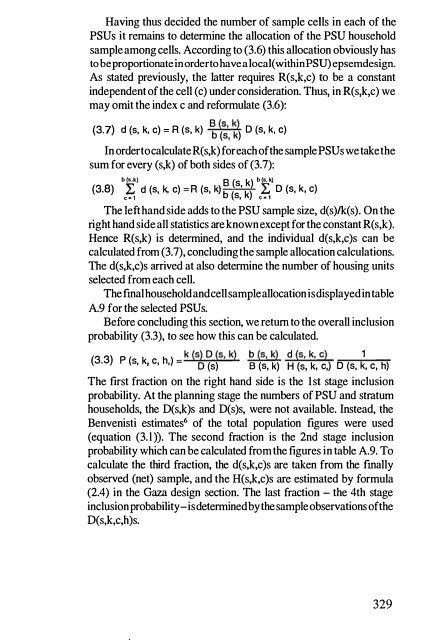
- Page 328 and 329: Selection of Sample PS Us (1st stag
- Page 332 and 333: 4 Arab Jerusalem Sample Design The
- Page 334 and 335: 1983 map (other statistical maps ha
- Page 336 and 337: technical character, mathematical f
- Page 338 and 339: By successively inserting the vario
- Page 340 and 341: within the con text of inclusion pr
- Page 342 and 343: Proceeding one step furtherthe stra
- Page 344 and 345: ecomes less uncertain, the assessme
- Page 346 and 347: Non-response is generally the most
- Page 348 and 349: Appendix B Recruitment, Training an
- Page 350 and 351: were approached and the purpose and
- Page 352 and 353: dealing with opinions without subco
- Page 354 and 355: which person was chosen as the rand
- Page 356 and 357: standards. A workable compromise wa
- Page 358 and 359: of the legal ranges were checked bo
- Page 360 and 361: 358
- Page 362 and 363: A2.2 Distribution of population by
- Page 364 and 365: A2.4 Age distribution by religion a
- Page 366 and 367: A2.6 Household composition by regio
- Page 368 and 369: A2.8 Household composition m occupi
- Page 370 and 371: A2.10 Percent of households in whic
- Page 372 and 373: A6.2 Household wealth by household
- Page 374 and 375: A6.4 Householdwealth in Gaza and th
- Page 376 and 377: A6.6 Householdweekly meat consumpti
- Page 378 and 379: A6.8 Percent of households eaming l
- Page 380 and 381:
A6. JO Head of Household labour inc
- Page 382 and 383:
A6. 12 Household income types in Ga
- Page 384 and 385:
A6. 14 Distribution ofhousehold inc
- Page 386 and 387:
the CBS survey is primarily conceme
- Page 388 and 389:
ent both on the definition of "unem
- Page 390 and 391:
Table A. 7.3 Labour force participa
- Page 392 and 393:
Table A. 7.4 Unemployed persons as
- Page 394 and 395:
Table A.7.5 "Discouraged" workers a
- Page 396 and 397:
Table A.7.6 (Continued) Full-time a
- Page 398 and 399:
Table A. 7.8 Labourforce members by
- Page 400 and 401:
Table A. 7. JO Male labour fo rce m
- Page 402 and 403:
Table A. 7. 12 Comparative composit
- Page 404 and 405:
Table A.7.J3 (Continued) Main emplo
- Page 406 and 407:
Table A. 7. 15 Distribution of labo
- Page 408 and 409:
Table A.l.Il Main employment of lab
- Page 410 and 411:
Table A. 7. 19 Main employment of l
- Page 412 and 413:
Table A. 7.20 Main employment of la
- Page 414 and 415:
Table A. 7. 22 Comparative composit
- Page 416 and 417:
Table A. 7.24 Labourforce members b
- Page 418 and 419:
Table A. 7. 26 Labour force members
- Page 420 and 421:
Table A. 7.28 Weekly time use for w
- Page 422:
PALESTINIAN SOCIETY in Gaza, West B