- Page 1:
Tesis Doctoral TRANSFORMACIONES HID
- Page 5:
AUTORIZACIÓN DE LOS DIRECTORES DE
- Page 9:
AGRADECIMIENTOS Esta memoria ha sid
- Page 12 and 13:
II.3.4. Diagramas de actividad y es
- Page 14 and 15:
Estudio de los productos sólidos m
- Page 17 and 18:
Introducción I. INTRODUCCIÓN 1
- Page 19 and 20:
I.1. LOS MINERALES DEL GRUPO DEL CA
- Page 21 and 22:
Introducción La estructura de la n
- Page 23 and 24:
Introducción I.2. TRANSFORMACIONES
- Page 25 and 26:
Introducción Tabla I.1. Principale
- Page 27 and 28:
Introducción observaciones textura
- Page 29 and 30:
Introducción Las transformaciones
- Page 31 and 32:
Introducción reacción de ilitizac
- Page 33 and 34:
Introducción enterramiento medio a
- Page 35 and 36:
Introducción tosudita en areniscas
- Page 37 and 38:
Introducción Foord et al. (1986) e
- Page 39:
I.3. OBJETIVOS El objetivo de este
- Page 42 and 43:
Metodología 26
- Page 44 and 45:
Metodología % en peso. La pérdida
- Page 46 and 47:
Metodología El diagrama de difracc
- Page 48 and 49:
Fig. II.2. Curvas de análisis tér
- Page 50 and 51:
Metodología El estudio mediante mi
- Page 52 and 53:
Metodología 36
- Page 54 and 55:
Metodología 38
- Page 56 and 57:
Metodología también, para el aná
- Page 58 and 59:
B. Reacciones a 250 o 300 ºC Metod
- Page 60 and 61:
Tabla II.4. Condiciones de análisi
- Page 62 and 63:
Metodología En el sistema MgO-Al2O
- Page 64 and 65:
Metodología requiere que la muestr
- Page 66 and 67:
Resultados 50
- Page 68 and 69:
Resultados productos. No obstante,
- Page 70 and 71:
Resultados 54
- Page 72 and 73:
Resultados 56
- Page 74 and 75:
Resultados 58
- Page 76 and 77:
3700 3660 3629 Resultados Fig. III.
- Page 78 and 79:
Resultados 62
- Page 80 and 81:
mmol/L mmol/L 8 6 4 2 0 50 40 30 20
- Page 82 and 83:
Resultados por nosotros, las soluci
- Page 84 and 85:
log a(Al 3+ )/a(H + ) 3 2 1 0 -1 -2
- Page 86 and 87:
Resultados es que la disolución de
- Page 89 and 90:
Resultados III.2. REACCIONES CON CA
- Page 91 and 92:
Resultados reflexiones 130-131; d)
- Page 93 and 94:
Intensidad 001 020 002 Reacción D
- Page 95 and 96:
Resultados Tampoco los espectros de
- Page 97 and 98:
Resultados Fig. III.16. Imágenes d
- Page 99 and 100:
III.2.2. ESTUDIO DE LAS SOLUCIONES
- Page 101 and 102:
Intensidad 3.94 3.84 10 20 30 40 50
- Page 103 and 104: K (mmol/L) Resultados Fig. III.21.
- Page 105 and 106: Resultados En los diagramas de DRX
- Page 107 and 108: Resultados Si la moscovita se susti
- Page 109 and 110: log a(Mg 2+ )/a(H + ) 2 10 8 6 4 2
- Page 111 and 112: III.2.3. DISCUSIÓN Resultados Son
- Page 113 and 114: Resultados El contenido en Al deter
- Page 115 and 116: Resultados III.3. REACCIONES CON CA
- Page 117 and 118: Resultados Los diagramas de las rea
- Page 119 and 120: Resultados Estos valores indican un
- Page 121 and 122: Resultados Fig. III.33. Espectros d
- Page 123 and 124: Resultados Fig. III.34. Imagen obte
- Page 125 and 126: III.3.2. ESTUDIO DE LAS SOLUCIONES
- Page 127 and 128: Resultados Estos datos revelan que
- Page 129 and 130: K (mmol/L) 128 E F G 124 120 116 0
- Page 131 and 132: Resultados fases estables. En ambos
- Page 133 and 134: III.3.3. DISCUSIÓN Resultados La s
- Page 135 and 136: Resultados III.4. REACCIONES CON CA
- Page 137 and 138: Intensidad ~ 12-14 ~ 12 9.30 ~ 10 0
- Page 139 and 140: Resultados Por último, el diagrama
- Page 141 and 142: Resultados Fig. III.47. Espectros d
- Page 143 and 144: Resultados Fig. III.48. Imágenes d
- Page 145 and 146: A B Resultados Fig. III.49. Imágen
- Page 147 and 148: Resultados Fig. III.50. Imágenes d
- Page 149 and 150: III.4.2. ESTUDIO DE LAS SOLUCIONES
- Page 151 and 152: Resultados 2.- A pesar de la difere
- Page 153: Resultados microclina. Cuando en lu
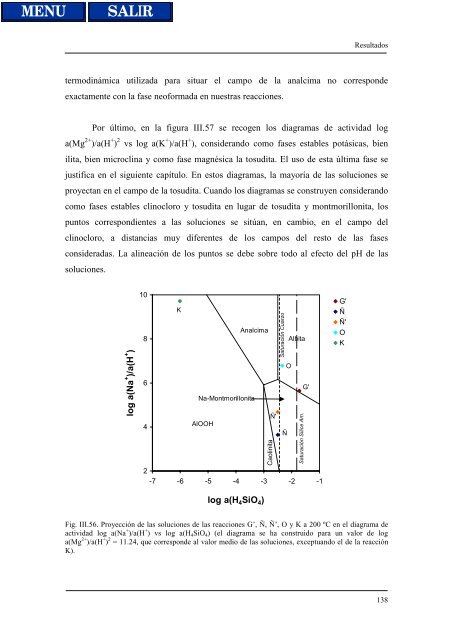
- Page 158 and 159: Resultados Esta figura muestra que
- Page 160 and 161: Resultados láminas curvadas de fil
- Page 162 and 163: Resultados 146
- Page 164 and 165: Resultados 148
- Page 166 and 167: Resultados 150
- Page 168 and 169: Resultados 152
- Page 170 and 171: Resultados 154
- Page 172 and 173: Resultados 156
- Page 174 and 175: Resultados 158
- Page 176 and 177: Resultados 160
- Page 178 and 179: Resultados indicaba la observación
- Page 180 and 181: Resultados Mg (6.5-10 átomos %). L
- Page 182 and 183: mmol/L 250 200 150 100 50 0 0 30 60
- Page 184 and 185: Resultados tabulado de la solubilid
- Page 186 and 187: Resultados 170
- Page 188 and 189: Intensidad 17.60 18.41 11.98 9.35 K
- Page 190 and 191: Resultados presencia de interestrat
- Page 192 and 193: Resultados próximas a montmorillon
- Page 194 and 195: Resultados 178
- Page 196 and 197: mmol/L Resultados Fig. III.77. Vari
- Page 198 and 199: Resultados microclina. En el segund
- Page 201 and 202: Resultados III.4.5. RESULTADOS DEL
- Page 203 and 204: Tabla III.16. Fases sólidas identi
- Page 205 and 206:
Il Kln Resultados Fig. III.85. Imag
- Page 207 and 208:
Resultados Fig. III.87. Imagen de a
- Page 209 and 210:
Resultados Algunas de las fórmulas
- Page 211 and 212:
Resultados La concentración de Si
- Page 213 and 214:
Resultados disolución de sílice e
- Page 215 and 216:
Resultados Por ello, en la figura I
- Page 217 and 218:
Resultados III.4.6. RESULTADOS DEL
- Page 219 and 220:
Estudio de los productos sólidos m
- Page 221 and 222:
Resultados Fig. III.96. Imagen de a
- Page 223 and 224:
Estudio de las soluciones Resultado
- Page 225 and 226:
log a(Al 3+ )/a(H + ) 3 5 4 3 2 1 0
- Page 227 and 228:
log a(Mg 2+ )/a(H + ) 2 15 12 9 6 C
- Page 229 and 230:
Resultados III.4.7. RESULTADOS DEL
- Page 231 and 232:
Intensidad Resultados En la figura
- Page 233 and 234:
Resultados podido ser identificada
- Page 235 and 236:
Resultados Fig. III.105. Imagen de
- Page 237 and 238:
Resultados Fig. III.106. Imagen de
- Page 239 and 240:
Estudio de las soluciones Resultado
- Page 241 and 242:
mmol/L 450 400 350 300 250 200 150
- Page 243 and 244:
log a(Na + )/a(H + ) 8 6 4 2 Analci
- Page 245 and 246:
Resultados En la figura III.112, se
- Page 247 and 248:
III.4.8. DISCUSIÓN Resultados Los
- Page 249 and 250:
Resultados 15 días), se origina la
- Page 251 and 252:
Resultados En sistemas químicos si
- Page 253:
Resultados detectable mediante DRX.
- Page 256 and 257:
Resultados III.5.1. CARACTERIZACIÓ
- Page 258 and 259:
Resultados En resumen, este conjunt
- Page 260 and 261:
Resultados deshidratación de las n
- Page 262 and 263:
Resultados descenso del los conteni
- Page 264 and 265:
log a(Al 3+ )/a(H + ) 3 5 4 3 2 1 0
- Page 266 and 267:
Resultados se origina una fase 2:1
- Page 268 and 269:
Intensidad 12.1 Z-Li 9.33 Kln Z-Li
- Page 270 and 271:
Resultados Tabla III. 25. Contenido
- Page 272 and 273:
log a(Al 3+ )/a(H + ) 3 5 4 3 2 1 0
- Page 274 and 275:
log a(Mg 2+ )/a(H + ) 2 14 12 10 8
- Page 276 and 277:
Resultados exactitud dada la presen
- Page 278 and 279:
Intensidad ≈ 12 Kln Reacción L (
- Page 280 and 281:
Intensidad 16.6 12.7 12.9 9.06 Kln
- Page 282 and 283:
Resultados tanto en el caso de la r
- Page 284 and 285:
Resultados 268
- Page 286 and 287:
Resultados 270
- Page 288 and 289:
Resultados 272
- Page 290 and 291:
Resultados Fig. III.142. Posición
- Page 292 and 293:
Tabla III.27. Datos químicos de la
- Page 294 and 295:
Resultados 278
- Page 296 and 297:
Resultados 280
- Page 298 and 299:
Resultados Tabla III.29. Datos quí
- Page 300 and 301:
Resultados La variabilidad química
- Page 302 and 303:
Resultados 286
- Page 304 and 305:
Resultados 288
- Page 306 and 307:
Resultados variaciones observadas e
- Page 308 and 309:
mmol/L 600 500 400 300 200 100 0 0
- Page 310 and 311:
log a(Al 3+ )/a(H + ) 3 5 4 3 2 1 0
- Page 312 and 313:
log a(Mg 2+ )/a(H + ) 2 15 13 11 9
- Page 314 and 315:
Resultados con etilénglicol, que t
- Page 316 and 317:
Resultados Los datos químicos obte
- Page 318 and 319:
Resultados 302
- Page 320 and 321:
mmol/L 90 60 30 0 0 10 20 30 Tiempo
- Page 322 and 323:
Resultados En la figura III.165 se
- Page 324 and 325:
Resultados 308
- Page 326 and 327:
400 ºC c) Esmectia (Li) Tosudita
- Page 328 and 329:
Resultados de manifiesto que en cie
- Page 330 and 331:
Resultados La evolución de la reac
- Page 332 and 333:
Discusión 316
- Page 334 and 335:
Discusión 318
- Page 336 and 337:
Discusión Por el contrario, en los
- Page 338 and 339:
Discusión 322
- Page 340 and 341:
Discusión experimentos hidrotermal
- Page 342 and 343:
Discusión corrensita y en clorita,
- Page 344 and 345:
Discusión Es evidente que en este
- Page 346 and 347:
Discusión reacción ocupa las posi
- Page 349 and 350:
V.1. CONCLUSIONES GENERALES Conclus
- Page 351 and 352:
Conclusiones B: La adición de síl
- Page 353 and 354:
V.2. CONCLUSIONES FINALES Conclusio
- Page 355:
V.3. LA CONTINUCACIÓN DE ESTA INVE
- Page 359 and 360:
Referencias Aagaard, P. & Helgeson,
- Page 361 and 362:
Referencias Berman, R.G. (1988) Int
- Page 363 and 364:
Referencias Bühman, D. (1988) An o
- Page 365 and 366:
Referencias De Ligny, D. & Navrotsk
- Page 367 and 368:
Referencias Frank-Kamenetskii, V.A.
- Page 369 and 370:
Referencias (105 Pascals) pressure
- Page 371 and 372:
Referencias Inoue, A. (1983) Potass
- Page 373 and 374:
Referencias Kunze, G.W. & Bradley,
- Page 375 and 376:
Referencias Mooney, R.W.; Keenan, A
- Page 377 and 378:
Referencias Proust, D.; Lechelle, J
- Page 379 and 380:
Referencias Schiffman, P. & Fridlei
- Page 381 and 382:
Referencias Tomura, S.; Shibasaki,
- Page 383:
Referencias Zen, E. (1960) Metamorp
- Page 387 and 388:
Apéndice I. Constantes de equilibr
- Page 389 and 390:
Apéndice III. Actividades de los c
- Page 391 and 392:
Apéndices O 15 -2.339 3.463 6.785
- Page 393 and 394:
Apéndice V. Listado de las figuras
- Page 395 and 396:
Apéndices Figura III.12. Diagramas
- Page 397 and 398:
Apéndices Figura III.35. Variació
- Page 399 and 400:
Apéndices Figura III.57. Proyecci
- Page 401 and 402:
Apéndices Figura III.76. Imágenes
- Page 403 and 404:
Apéndices de las soluciones). La f
- Page 405 and 406:
Apéndices Figura III.112. Posició
- Page 407 and 408:
Apéndices Figura III.137. Diagrama
- Page 409 and 410:
Apéndices Figura III.157. Posició
- Page 411 and 412:
Apéndice VI. Listado de las tablas
- Page 413:
Apéndices Tabla III.29. Datos quí