- Page 3:
EL ABSENTISMO LABORAL: ANTECEDENTES
- Page 6 and 7:
Esta publicación no puede ser repr
- Page 8 and 9:
CAPÍTULO 2. ANÁLISIS DESCRIPTIVO
- Page 11 and 12:
PRESENTACIÓN DEL RECTOR DE LA UNIV
- Page 13 and 14:
PRESENTACIÓN DE LOS AUTORES En jul
- Page 15 and 16:
INTRODUCCIÓN El presente trabajo e
- Page 17:
INTRODUCCIÓN y antigüedad) y orga
- Page 20 and 21:
J. M. PEIRÓ, I. RODRÍGUEZ-MOLINA
- Page 22 and 23:
J. M. PEIRÓ, I. RODRÍGUEZ-MOLINA
- Page 24 and 25:
J. M. PEIRÓ, I. RODRÍGUEZ-MOLINA
- Page 26 and 27:
J. M. PEIRÓ, I. RODRÍGUEZ-MOLINA
- Page 28 and 29: J. M. PEIRÓ, I. RODRÍGUEZ-MOLINA
- Page 30 and 31: J. M. PEIRÓ, I. RODRÍGUEZ-MOLINA
- Page 32 and 33: J. M. PEIRÓ, I. RODRÍGUEZ-MOLINA
- Page 34 and 35: J. M. PEIRÓ, I. RODRÍGUEZ-MOLINA
- Page 36 and 37: J. M. PEIRÓ, I. RODRÍGUEZ-MOLINA
- Page 38 and 39: J. M. PEIRÓ, I. RODRÍGUEZ-MOLINA
- Page 40 and 41: J. M. PEIRÓ, I. RODRÍGUEZ-MOLINA
- Page 42 and 43: J. M. PEIRÓ, I. RODRÍGUEZ-MOLINA
- Page 44 and 45: J. M. PEIRÓ, I. RODRÍGUEZ-MOLINA
- Page 46 and 47: J. M. PEIRÓ, I. RODRÍGUEZ-MOLINA
- Page 48 and 49: J. M. PEIRÓ, I. RODRÍGUEZ-MOLINA
- Page 50 and 51: J. M. PEIRÓ, I. RODRÍGUEZ-MOLINA
- Page 52 and 53: J. M. PEIRÓ, I. RODRÍGUEZ-MOLINA
- Page 54 and 55: J. M. PEIRÓ, I. RODRÍGUEZ-MOLINA
- Page 56 and 57: J. M. PEIRÓ, I. RODRÍGUEZ-MOLINA
- Page 59 and 60: ANÁLISIS DESCRIPTIVO DEL ABSENTISM
- Page 61 and 62: 2.2 Variables ANÁLISIS DESCRIPTIVO
- Page 63 and 64: 15% 10% 5% 0% ANÁLISIS DESCRIPTIVO
- Page 65 and 66: ANÁLISIS DESCRIPTIVO DEL ABSENTISM
- Page 67 and 68: 10% 5% 0% ANÁLISIS DESCRIPTIVO DEL
- Page 69 and 70: ANÁLISIS DESCRIPTIVO DEL ABSENTISM
- Page 71 and 72: ANÁLISIS DESCRIPTIVO DEL ABSENTISM
- Page 73 and 74: 100 80 60 40 20 0 45,7 ANÁLISIS DE
- Page 75 and 76: 25% 20% 15% 10% 5% 0% 6,3% ANÁLISI
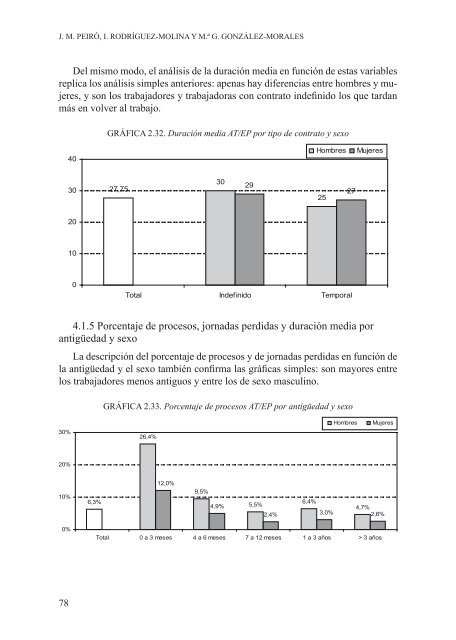
- Page 77: 50 40 30 20 10 0 ANÁLISIS DESCRIPT
- Page 81 and 82: ANÁLISIS DESCRIPTIVO DEL ABSENTISM
- Page 83 and 84: ANÁLISIS DESCRIPTIVO DEL ABSENTISM
- Page 85 and 86: ANÁLISIS DESCRIPTIVO DEL ABSENTISM
- Page 87 and 88: ANÁLISIS DESCRIPTIVO DEL ABSENTISM
- Page 89 and 90: ANÁLISIS DESCRIPTIVO DEL ABSENTISM
- Page 91 and 92: ANÁLISIS DESCRIPTIVO DEL ABSENTISM
- Page 93 and 94: ANÁLISIS DESCRIPTIVO DEL ABSENTISM
- Page 95 and 96: ANÁLISIS DESCRIPTIVO DEL ABSENTISM
- Page 97 and 98: ANÁLISIS DESCRIPTIVO DEL ABSENTISM
- Page 99 and 100: ANÁLISIS DESCRIPTIVO DEL ABSENTISM
- Page 101 and 102: ANÁLISIS DESCRIPTIVO DEL ABSENTISM
- Page 103 and 104: 0-3 meses 4-6 meses 7-12 meses 1-3
- Page 105 and 106: ANÁLISIS DESCRIPTIVO DEL ABSENTISM
- Page 107 and 108: 60 40 20 0 ANÁLISIS DESCRIPTIVO DE
- Page 109 and 110: ANÁLISIS DESCRIPTIVO DEL ABSENTISM
- Page 111 and 112: ANÁLISIS DESCRIPTIVO DEL ABSENTISM
- Page 113 and 114: ANÁLISIS DESCRIPTIVO DEL ABSENTISM
- Page 115 and 116: ANÁLISIS DESCRIPTIVO DEL ABSENTISM
- Page 117 and 118: ANÁLISIS DESCRIPTIVO DEL ABSENTISM
- Page 119 and 120: ANÁLISIS DESCRIPTIVO DEL ABSENTISM
- Page 121 and 122: 0-3 meses 4-6 meses 7-12 meses 1-3
- Page 123 and 124: 0-3 meses 4-6 meses 7-12 meses 1-3
- Page 125 and 126: ANÁLISIS DESCRIPTIVO DEL ABSENTISM
- Page 127 and 128: ANÁLISIS DE LAS PERSPECTIVAS DE LO
- Page 129 and 130:
ANÁLISIS DE LAS PERSPECTIVAS DE LO
- Page 131 and 132:
ANÁLISIS DE LAS PERSPECTIVAS DE LO
- Page 133 and 134:
ANÁLISIS DE LAS PERSPECTIVAS DE LO
- Page 135 and 136:
ANÁLISIS DE LAS PERSPECTIVAS DE LO
- Page 137 and 138:
ANÁLISIS DE LAS PERSPECTIVAS DE LO
- Page 139 and 140:
ANÁLISIS DE LAS PERSPECTIVAS DE LO
- Page 141 and 142:
ANÁLISIS DE LAS PERSPECTIVAS DE LO
- Page 143 and 144:
ANÁLISIS DE LAS PERSPECTIVAS DE LO
- Page 145 and 146:
ANÁLISIS DE LAS PERSPECTIVAS DE LO
- Page 147 and 148:
ANÁLISIS DE LAS PERSPECTIVAS DE LO
- Page 149 and 150:
ANÁLISIS DE LAS PERSPECTIVAS DE LO
- Page 151 and 152:
ANÁLISIS DE LAS PERSPECTIVAS DE LO
- Page 153 and 154:
ANÁLISIS DE LAS PERSPECTIVAS DE LO
- Page 155 and 156:
ANÁLISIS DE LAS PERSPECTIVAS DE LO
- Page 157 and 158:
ANÁLISIS DE LAS PERSPECTIVAS DE LO
- Page 159 and 160:
ANÁLISIS DE LAS PERSPECTIVAS DE LO
- Page 161 and 162:
ANÁLISIS DE LAS PERSPECTIVAS DE LO
- Page 163 and 164:
ANÁLISIS DE LAS PERSPECTIVAS DE LO
- Page 165 and 166:
ANÁLISIS DE LAS PERSPECTIVAS DE LO
- Page 167 and 168:
ANÁLISIS DE LAS PERSPECTIVAS DE LO
- Page 169 and 170:
ANÁLISIS DE LAS PERSPECTIVAS DE LO
- Page 171 and 172:
ANÁLISIS DE LAS PERSPECTIVAS DE LO
- Page 173 and 174:
ANÁLISIS DE LAS PERSPECTIVAS DE LO
- Page 175 and 176:
ANÁLISIS DE LAS PERSPECTIVAS DE LO
- Page 177 and 178:
ANÁLISIS DE LAS PERSPECTIVAS DE LO
- Page 179 and 180:
ANTECENTES PULL Características GR
- Page 181 and 182:
ANÁLISIS DE LAS PERSPECTIVAS DE LO
- Page 183 and 184:
ANÁLISIS DE LAS PERSPECTIVAS DE LO
- Page 185 and 186:
RESUMEN Y CONCLUSIONES La lectura d
- Page 187 and 188:
RESUMEN Y CONCLUSIONES 7. Las alter
- Page 189 and 190:
EDAD Procesos AT/EP Procesos CC PP:
- Page 191 and 192:
TIPO DE CONTRATO x EDAD Procesos AT
- Page 193 and 194:
TAMAÑO ORGANIZACIONAL Procesos AT/
- Page 195 and 196:
RESUMEN Y CONCLUSIONES En AT/EP las
- Page 197 and 198:
RESUMEN Y CONCLUSIONES la baja» y
- Page 199 and 200:
RESUMEN Y CONCLUSIONES falta de coo
- Page 201 and 202:
RESUMEN Y CONCLUSIONES hasta que se
- Page 203 and 204:
RESUMEN Y CONCLUSIONES visión meno
- Page 205:
RESUMEN Y CONCLUSIONES bién influy
- Page 208 and 209:
J. M. PEIRÓ, I. RODRÍGUEZ-MOLINA
- Page 210:
J. M. PEIRÓ, I. RODRÍGUEZ-MOLINA