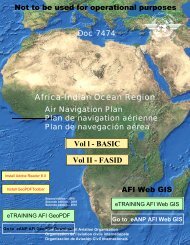
- Page 1 and 2: Doc 7474 Africa-Indian Ocean Region
- Page 3 and 4: FACILITIES AND SERVICES IMPLEMENTAT
- Page 5 and 6: 0-E-iv AFI FASID Page Part V — Ai
- Page 7 and 8: 0-F-III TABLE DES MATIÈRES Introdu
- Page 9 and 10: Table des matières 0-F-V Partie VI
- Page 11 and 12: 0-F-1 INTRODUCTION — FASID 1. Le
- Page 13 and 14: I-F-1 Partie I BESOINS FONDAMENTAUX
- Page 15 and 16: II-E-2 12. It was assumed that thos
- Page 17 and 18: II-E-4 31. International cooperatio
- Page 19 and 20: II-E-6 latitude. These services com
- Page 21 and 22: II-E-8 concerned; c) managerial imp
- Page 23 and 24: II-E-10 and to whom he or she would
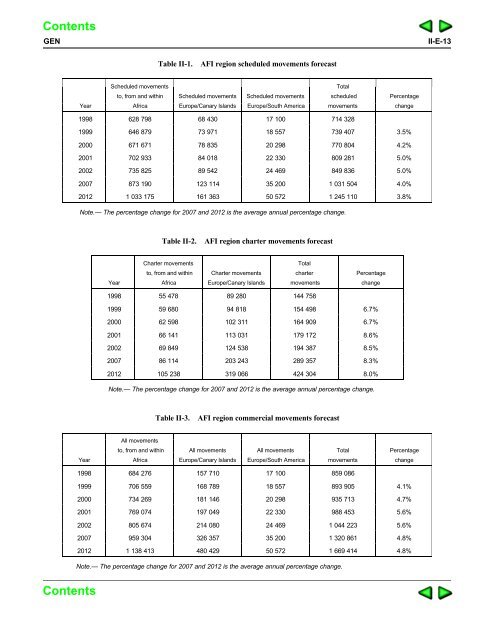
- Page 25: II-E-12 organization or an internat
- Page 29 and 30: II-E-16 AFI FASID Table II-7. Forec
- Page 31 and 32: II-E-18 AFI FASID Table II-11. Sche
- Page 33 and 34: II-E-20 AFI FASID Area of routing (
- Page 35 and 36: II-E-22 AFI FASID Figure II-3 Areas
- Page 37 and 38: II-F-2 la fréquence à au moins un
- Page 39 and 40: II-F-4 b) l’existence d’un syst
- Page 41 and 42: II-F-6 FASID AFI organismes. mondia
- Page 43 and 44: II-F-8 Application des dispositions
- Page 45 and 46: II-F-10 certaines circonstances, il
- Page 47 and 48: II-F-12 Conformément à la démarc
- Page 49 and 50: II-F-14 à une annexe (pour laquell
- Page 51 and 52: II-F-16 FASID AFI Tableau II-4. Pr
- Page 53 and 54: II-F-18 FASID AFI Tableau II-7. Pr
- Page 55 and 56: II-F-20 FASID AFI Tableau II-11. R
- Page 57 and 58: II-F-22 FASID AFI Zone d’achemine
- Page 59 and 60: II-F-24 FASID AFI Figure II-3. Zone
- Page 61 and 62: III-F-1 Partie III PLANIFICATION OP
- Page 63 and 64: III-AOP 1-2 AFI FASID 4 Air traffic
- Page 65 and 66: III-AOP 1-4 AFI FASID 12 Marking ai
- Page 67 and 68: III-AOP 1-6 AFI FASID le B747 et le
- Page 69 and 70: III-AOP 1-8 AFI FASID EXPLICACIÓN
- Page 71 and 72: III-AOP 1-10 AFI FASID ILS requerid
- Page 73 and 74: AOP III-AOP 1-13 ATS Physical chara
- Page 75 and 76: AOP III-AOP 1-15 ATS Physical chara
- Page 77 and 78:
AOP III-AOP 1-17 ATS Physical chara
- Page 79 and 80:
AOP III-AOP 1-19 ATS Physical chara
- Page 81 and 82:
AOP III-AOP 1-21 ATS Physical chara
- Page 83 and 84:
AOP III-AOP 1-23 ATS Physical chara
- Page 85 and 86:
AOP III-AOP 1-25 ATS Physical chara
- Page 87 and 88:
AOP III-AOP 1-27 ATS Physical chara
- Page 89 and 90:
AOP III-AOP 1-29 ATS Physical chara
- Page 91 and 92:
AOP III-AOP 1-31 ATS Physical chara
- Page 93 and 94:
AOP III-AOP 1-33 ATS Physical chara
- Page 95 and 96:
AFI FASID ÍNDICE DE AERÓDROMOS CA
- Page 97 and 98:
IV-E-1 Part IV COMMUNICATIONS, NAVI
- Page 99 and 100:
IV-CNS 1A-1 Table CNS 1A — Tablea
- Page 101 and 102:
CNS IV-CNS 1A-3 Terminal I Terminal
- Page 103 and 104:
CNS IV-CNS 1A-5 Terminal I Terminal
- Page 105 and 106:
CNS IV-CNS 1B-1 IV-CNS 1B-1 Table C
- Page 107 and 108:
IV-CNS 1C-1 Table CNS 1C ATS MESSAG
- Page 109 and 110:
CNS IV-CNS 1C-3 Administration Loca
- Page 111 and 112:
IV-CNS 1B-2 FASID AFI 3 Type de rou
- Page 113 and 114:
IV-CNS 1C-1 Table CNS 1C — Tablea
- Page 115 and 116:
IV-CNS 1D-1 Table CNS 1D — Tablea
- Page 117 and 118:
CNS IV-CNS 1D-3 ATS requirements fo
- Page 119 and 120:
CNS IV-CNS 1D-5 ATS requirements fo
- Page 121 and 122:
CNS IV-CNS 1D-7 ATS requirements fo
- Page 123 and 124:
CNS IV-CNS 1D-9 ATS requirements fo
- Page 125 and 126:
CNS IV-CNS 1D-11 ATS requirements f
- Page 127 and 128:
CNS IV-CNS 1D-13 ATS requirements f
- Page 129:
AFI FASID PLAN DE CIRCUITOS ORALES
- Page 132 and 133:
IV-CNS 2-2 AFI FASID EXPLICATION DU
- Page 134 and 135:
CNS IV-CNS 2-5 Location and functio
- Page 136 and 137:
CNS IV-CNS 2-7 Location and functio
- Page 138 and 139:
CNS IV-CNS 2-9 Location and functio
- Page 140 and 141:
CNS IV-CNS 2-11 Location and functi
- Page 142 and 143:
CNS IV-CNS 2-13 Location and functi
- Page 144 and 145:
CNS IV-CNS 2-15 Location and functi
- Page 146 and 147:
CNS IV-CNS 2-17 VHF FREQUENCY UTILI
- Page 148 and 149:
CNS IV-CNS 2-19 Function Fonction F
- Page 150 and 151:
IV-CNS 2-22 AFI FASID Frequency Fr
- Page 152 and 153:
IV-CNS 2-24 AFI FASID Columna 12
- Page 154 and 155:
IV-CNS 3-1 Table CNS 3 — Tableau
- Page 156 and 157:
CNS IV-CNS 3-3 4 ILS — Système d
- Page 158 and 159:
CNS IV-CNS 3-5 GNSS — sistema mun
- Page 160 and 161:
IV-CNS 3-8 AFI FASID Station/Territ
- Page 162 and 163:
IV-CNS 3-10 AFI FASID Station/Terri
- Page 164 and 165:
IV-CNS 3-12 AFI FASID Station/Terri
- Page 166 and 167:
IV-CNS 3-14 AFI FASID Station/Terri
- Page 168 and 169:
IV-CNS 3-16 AFI FASID Station/Terri
- Page 170 and 171:
IV-CNS 3-18 AFI FASID Station/Terri
- Page 172 and 173:
IV-CNS 3-20 AFI FASID Station/Terri
- Page 174 and 175:
IV-CNS 3-22 AFI FASID Station/Terri
- Page 176 and 177:
IV-CNS 3-24 AFI FASID Station/Terri
- Page 178 and 179:
IV-CNS 3-A-E-1 Appendix A to Table
- Page 180 and 181:
IV-CNS 3-B-E-1 Appendix B to Table
- Page 182 and 183:
CNS IV-CNS 3-B-E-3 AFI GNSS Strateg
- Page 184 and 185:
IV-CNS 3-B-F-2 FASID AFI b) élabor
- Page 186 and 187:
AFI FASID EN-ROUTE RADIO NAVIGATION
- Page 188 and 189:
AFI FASID -20° -10° AIDS TO FINAL
- Page 190 and 191:
IV-CNS 4A-1 Table CNS 4A — Tablea
- Page 192 and 193:
IV-CNS 4A-6 AFI FASID State/Territo
- Page 194 and 195:
IV-CNS 4B-1 Table CNS 4B — Tablea
- Page 196 and 197:
CNS IV-CNS 4A-3 A — Installation
- Page 198 and 199:
IV-CNS 4B-8 AFI FASID State/Territo
- Page 200 and 201:
V-E-1 Part V AIR TRAFFIC MANAGEMENT
- Page 202 and 203:
V-A-E-1 Appendix A ATM EVOLUTION TA
- Page 204 and 205:
ATM V-A-E-3 1. Area of routing AR-4
- Page 206 and 207:
ATM V-A-E-5 1. Area of routing AR-9
- Page 208 and 209:
ATM V-A-E-7 TABLE 3 — CATEGORIZAT
- Page 210 and 211:
ATM V-A-E-9 State TMA Type Aerodrom
- Page 212 and 213:
ATM V-A-E-11 TABLE 4 — ATM OPERAT
- Page 214 and 215:
ATM V-A-E-13 Code ATM operational R
- Page 216 and 217:
V-A-F-2 FASID AFI 1. Zone d’achem
- Page 218 and 219:
V-A-F-4 FASID AFI 1. Zone d’achem
- Page 220 and 221:
V-A-F-6 FASID AFI 1. Zone d’achem
- Page 222 and 223:
V-A-F-8 FASID AFI TABLEAU 3 — CAT
- Page 224 and 225:
V-A-F-10 FASID AFI État TMA Type A
- Page 226 and 227:
V-A-F-12 FASID AFI TABLEAU 4 — BE
- Page 228 and 229:
V-A-F-14 FASID AFI Code Améliorati
- Page 230 and 231:
V-B-E-2 AFI FASID Distribution of c
- Page 232 and 233:
V-B-E-4 purposes provided a buffer
- Page 234 and 235:
V-B-E-6 AFI FASID CONSIDERATIONS RE
- Page 236 and 237:
V-B-E-8 Note.— It is expected tha
- Page 238 and 239:
V-B-E-10 PAs. This procedure should
- Page 240 and 241:
V-B-F-2 relatives au perfectionneme
- Page 242 and 243:
V-B-F-4 FIR entre la zone où le co
- Page 244 and 245:
V-B-F-6 FASID AFI CONSIDÉRATIONS R
- Page 246 and 247:
V-B-F-8 retentissements sur l’all
- Page 248 and 249:
V-B-F-10 période de protection, le
- Page 250 and 251:
V-2B-1 Table ATS 2B — Tableau ATS
- Page 252 and 253:
V-3-2 AFI FASID FIR (ACCRA - KANO)
- Page 254 and 255:
V-3-4 AFI FASID FIR (KHARTOUM - WIN
- Page 256 and 257:
AFI FASID VOLMET BROADCASTS ÉMISSI
- Page 258 and 259:
VI-E-2 the TCAC are contained in Ta
- Page 260 and 261:
VI-F-2 CENTRES D’AVIS DE CYCLONES
- Page 262 and 263:
VI-MET 1A-2 AFI FASID 4 Nom du cent
- Page 264 and 265:
VI-MET 1A-4 AFI FASID Aerodrome whe
- Page 266 and 267:
VI-MET 1A-6 AFI FASID Aerodrome whe
- Page 268 and 269:
VI-MET 1A-8 AFI FASID Aerodrome whe
- Page 270 and 271:
VI-MET 1A-10 AFI FASID Aerodrome wh
- Page 272 and 273:
VI-MET 1A-12 AFI FASID Aerodrome wh
- Page 274 and 275:
CHART SHOWING THE AFTN ROUTING AREA
- Page 276 and 277:
VI-MET 1B-2 AFI FASID EXPLICACIÓN
- Page 278 and 279:
MET VI-MET 1B-3 Area served/Région
- Page 280 and 281:
MET VI-MET 1B-5 Area served/Région
- Page 282 and 283:
MET VI-MET 2A-3 TO BE AVAILABLE IN/
- Page 284 and 285:
MET VI-MET 2A-5 TO BE AVAILABLE IN/
- Page 286 and 287:
MET VI-MET 2A-7 TO BE AVAILABLE IN/
- Page 288 and 289:
MET VI-MET 2A-9 TO BE AVAILABLE IN/
- Page 290 and 291:
MET VI-MET 2A-11 TO BE AVAILABLE IN
- Page 292 and 293:
MET VI-MET 2A-13 TO BE AVAILABLE IN
- Page 294 and 295:
MET VI-MET 2A-15 TO BE AVAILABLE IN
- Page 296 and 297:
MET VI-MET 2A-17 TO BE AVAILABLE IN
- Page 298 and 299:
VI-MET 2B-1 Table MET 2B — Tablea
- Page 300 and 301:
VI-MET 2B-4 AFI FASID TO BE AVAILAB
- Page 302 and 303:
VI-MET 2B-6 AFI FASID TO BE AVAILAB
- Page 304 and 305:
VI-MET 2B-8 AFI FASID TO BE AVAILAB
- Page 306 and 307:
VI-MET 2C-1 Table MET 2C — Tablea
- Page 308 and 309:
MET VI-MET 2C-3 To be available in
- Page 310 and 311:
VI-MET 3A-1 Table MET 3A — Tablea
- Page 312 and 313:
MET VI-MET 3A-3 Tropical cyclone ad
- Page 314 and 315:
VI-MET 3B-2 AFI FASID EXPLICACIÓN
- Page 316 and 317:
MET VI-MET 3B-3 Volcanic ash adviso
- Page 318 and 319:
$J $J J J NAT FASID CURRENT STATUS
- Page 320 and 321:
MET VI-MET 4A-3 TAF Collection cent
- Page 322 and 323:
MET VI-MET 4A-3 TAF Collection cent
- Page 324 and 325:
MET VI-MET 4B-3 AIREP Collection ce
- Page 326 and 327:
MET VI-MET 5-3 Product required Pro
- Page 328 and 329:
VI-MET 6-1 Table MET 6 — Tableau
- Page 330 and 331:
MET VI-MET 6-3 SIGWX Upper-wind and
- Page 332 and 333:
MAXIMUM AREAS OF COVERAGE - MERCATO
- Page 334 and 335:
WAFS MAXIMUM AREAS OF COVERAGE - EU
- Page 336 and 337:
VI-MET 7-2 AFI FASID EXPLICATION DU
- Page 338 and 339:
VI-MET 7-4 AFI FASID Satellite dist
- Page 340 and 341:
MET VI-MET 7-3 State/Territory User
- Page 342 and 343:
MAXIMUM AREAS OF COVERAGE - POLAR S
- Page 344 and 345:
VII-F-1 Partie VII RECHERCHES ET SA
- Page 346 and 347:
VII-SAR 1-2 AFI FASID Colonne 1 Nom
- Page 348 and 349:
SAR VII-SAR 1-5 RCC and rescue unit
- Page 350 and 351:
SAR VII-SAR 1-7 RCC and rescue unit
- Page 352 and 353:
SAR VII-SAR 1-9 RCC and rescue unit
- Page 354 and 355:
VIII-E-1 Part VIII AERONAUTICAL INF
- Page 356 and 357:
VIII-AIS 1-1 Table AIS 1 — Tablea
- Page 358 and 359:
AIS VIII-AIS 1-3 State or Territory
- Page 360 and 361:
AIS VIII-AIS 1-5 State or Territory
- Page 362 and 363:
VIII-AIS 2-1 Table AIS 2 — Tablea
- Page 364 and 365:
AIS VIII-AIS 2-3 8 Disponibilité d
- Page 366 and 367:
VIII-AIS 2-6 AFI FASID Aerodrome wh
- Page 368 and 369:
VIII-AIS 2-8 AFI FASID Aerodrome wh
- Page 370 and 371:
VIII-AIS 2-10 AFI FASID Aerodrome w
- Page 372 and 373:
VIII-AIS 2-12 AFI FASID Aerodrome w
- Page 374 and 375:
VIII-AIS 2-14 AFI FASID
- Page 376 and 377:
VIII-AIS 3-2 AFI FASID NOF Areas of
- Page 378 and 379:
VIII-AIS 4-1 Table AIS 4 — Tablea
- Page 380 and 381:
VIII-AIS 4-4 AFI FASID TO BE AVAILA
- Page 382 and 383:
VIII-AIS 4-6 AFI FASID TO BE AVAILA
- Page 384 and 385:
VIII-AIS 4-8 AFI FASID TO BE AVAILA
- Page 386 and 387:
VIII-AIS 4-10 AFI FASID TO BE AVAIL
- Page 388 and 389:
VIII-AIS 4-12 AFI FASID TO BE AVAIL
- Page 390 and 391:
VIII-AIS 4-14 AFI FASID TO BE AVAIL
- Page 392 and 393:
VIII-AIS 4-16 AFI FASID TO BE AVAIL
- Page 394 and 395:
VIII-AIS 4-18 AFI FASID TO BE AVAIL
- Page 396 and 397:
VIII-AIS 4-20 AFI FASID TO BE AVAIL
- Page 398 and 399:
VIII-AIS 4-22 AFI FASID TO BE AVAIL
- Page 400 and 401:
VIII-AIS 4-24 AFI FASID TO BE AVAIL
- Page 402 and 403:
VIII-AIS 4-26 AFI FASID TO BE AVAIL
- Page 404 and 405:
VIII-AIS 4-28 AFI FASID TO BE AVAIL
- Page 406 and 407:
VIII-AIS 4-30 AFI FASID TO BE AVAIL
- Page 408 and 409:
VIII-AIS 4-32 AFI FASID TO BE AVAIL
- Page 410 and 411:
VIII-AIS 4-34 AFI FASID TO BE AVAIL
- Page 412 and 413:
VIII-AIS 4-36 AFI FASID TO BE AVAIL
- Page 414 and 415:
VIII-AIS 4-38 AFI FASID TO BE AVAIL
- Page 416 and 417:
VIII-AIS 4-40 AFI FASID TO BE AVAIL
- Page 418 and 419:
VIII-AIS 4-42 AFI FASID TO BE AVAIL
- Page 420 and 421:
VIII-AIS 4-44 AFI FASID TO BE AVAIL
- Page 422 and 423:
VIII-AIS 4-46 AFI FASID TO BE AVAIL
- Page 424 and 425:
VIII-AIS 4-48 AFI FASID TO BE AVAIL
- Page 426 and 427:
VIII-AIS 4-50 AFI FASID TO BE AVAIL
- Page 428 and 429:
VIII-AIS 4-52 AFI FASID TO BE AVAIL
- Page 430 and 431:
VIII-AIS 4-54 AFI FASID TO BE AVAIL
- Page 432 and 433:
VIII-AIS 4-56 AFI FASID TO BE AVAIL
- Page 434 and 435:
VIII-AIS 4-58 AFI FASID TO BE AVAIL
- Page 436 and 437:
VIII-AIS 5-2 AFI FASID 11 Requireme
- Page 438 and 439:
VIII-AIS 5-4 AFI FASID 12 Requisito
- Page 440 and 441:
VIII-AIS 5-6 AFI FASID State, terri
- Page 442 and 443:
VIII-AIS 5-8 AFI FASID State, terri
- Page 444 and 445:
VIII-AIS 5-10 AFI FASID State, terr
- Page 446 and 447:
VIII-AIS 5-12 AFI FASID State, terr
- Page 448 and 449:
VIII-AIS 5-14 AFI FASID State, terr
- Page 450 and 451:
VIII-AIS 5-16 AFI FASID State, terr
- Page 452 and 453:
VIII-AIS 5-18 AFI FASID State, terr
- Page 454 and 455:
VIII-AIS 5-20 AFI FASID State, terr
- Page 456 and 457:
VIII-AIS 5-22 AFI FASID State, terr
- Page 458 and 459:
VIII-AIS 6-2 AFI FASID 10 Requireme
- Page 460 and 461:
VIII-AIS 6-4 AFI FASID 10 Requisito
- Page 462 and 463:
VIII-AIS 6-6 AFI FASID State, terri
- Page 464 and 465:
VIII-AIS 6-8 AFI FASID State, terri
- Page 466 and 467:
VIII-AIS 6-10 AFI FASID State, terr
- Page 468 and 469:
VIII-AIS 6-12 AFI FASID State, terr
- Page 470 and 471:
VIII-AIS 6-14 AFI FASID State, terr
- Page 472 and 473:
VIII-AIS 6-16 AFI FASID State, terr
- Page 474 and 475:
VIII-AIS 6-18 AFI FASID State, terr
- Page 476 and 477:
VIII-AIS 6-20 AFI FASID State, terr
- Page 478 and 479:
VIII-AIS 6-22 AFI FASID State, terr
- Page 480 and 481:
VIII-AIS 7-2 AFI FASID EXPLICACIÓN
- Page 483 and 484:
VIII-AIS 8-1 Table AIS 8 — Tablea
- Page 485 and 486:
AIS VIII-AIS 8-3 Columna 1 Nombre d
- Page 487 and 488:
VIII-AIS 8-6 AFI FASID AIP amendmen
- Page 489 and 490:
VIII-A-E-2 AFI FASID GEODETIC CONSI
- Page 491 and 492:
VIII-A-E-4 AFI FASID TERMINOLOGY Fo
- Page 493 and 494:
VIII-A-F-2 CONSIDÉRATIONS GÉODÉS
- Page 495 and 496:
VIII-A-F-4 FASID AFI DÉFINITIONS D
- Page 497:
A-E-1 Appendix SUMMARY OF AMENDMENT