Rapport d'activité 2011 - Le portail web de la science politique
Rapport d'activité 2011 - Le portail web de la science politique
Rapport d'activité 2011 - Le portail web de la science politique

Create successful ePaper yourself
Turn your PDF publications into a flip-book with our unique Google optimized e-Paper software.
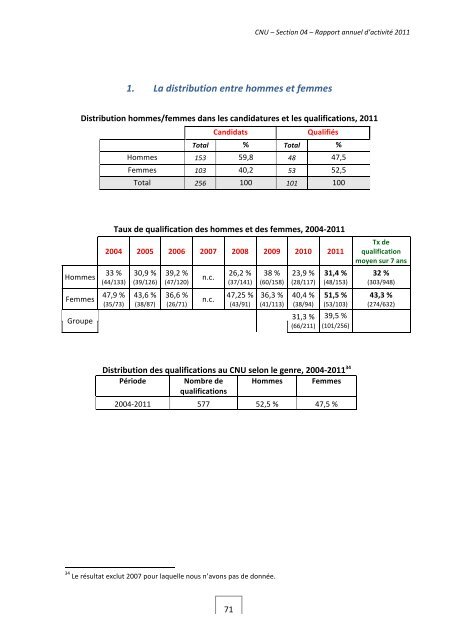
CNU – Section 04 – <strong>Rapport</strong> annuel d’activité <strong>2011</strong> 1. La distribution entre hommes et femmes Distribution hommes/femmes dans les candidatures et les qualifications, <strong>2011</strong> Candidats Qualifiés Total % Total % Hommes 153 59,8 48 47,5 Femmes 103 40,2 53 52,5 Total 256 100 101 100 Hommes Femmes Groupe Taux <strong>de</strong> qualification <strong>de</strong>s hommes et <strong>de</strong>s femmes, 2004-‐<strong>2011</strong> 2004 2005 2006 2007 2008 2009 2010 <strong>2011</strong> 33 % (44/133) 47,9 % (35/73) 30,9 % (39/126) 43,6 % (38/87) 39,2 % (47/120) 36,6 % (26/71) n.c. n.c. 26,2 % (37/141) 47,25 % (43/91) 38 % (60/158) 36,3 % (41/113) 23,9 % (28/117) 40,4 % (38/94) 31,4 % (48/153) 51,5 % (53/103) 31,3 % 39,5 % (66/211) (101/256) Tx <strong>de</strong> qualification moyen sur 7 ans 32 % (303/948) 43,3 % (274/632) Distribution <strong>de</strong>s qualifications au CNU selon le genre, 2004-‐<strong>2011</strong> 34Pério<strong>de</strong> Nombre <strong>de</strong> qualifications Hommes Femmes 2004-‐<strong>2011</strong> 577 52,5 % 47,5 % 34 <strong>Le</strong> résultat exclut 2007 pour <strong>la</strong>quelle nous n’avons pas <strong>de</strong> donnée. 71