NHS pay review body: twenty-sixth report 2012 - Official Documents
NHS pay review body: twenty-sixth report 2012 - Official Documents
NHS pay review body: twenty-sixth report 2012 - Official Documents

Create successful ePaper yourself
Turn your PDF publications into a flip-book with our unique Google optimized e-Paper software.
2.3<br />
Full time equivalent staff<br />
8<br />
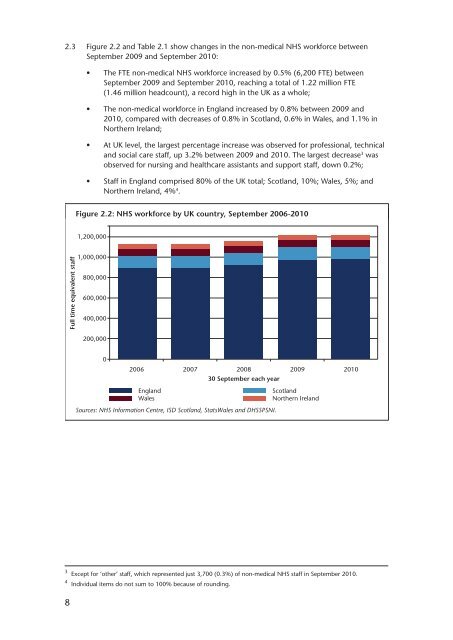
Figure 2.2 and Table 2.1 show changes in the non-medical <strong>NHS</strong> workforce between<br />
September 2009 and September 2010:<br />
•<br />
•<br />
•<br />
•<br />
The FTE non-medical <strong>NHS</strong> workforce increased by 0.5% (6,200 FTE) between<br />
September 2009 and September 2010, reaching a total of 1.22 million FTE<br />
(1.46 million headcount), a record high in the UK as a whole;<br />
The non-medical workforce in England increased by 0.8% between 2009 and<br />
2010, compared with decreases of 0.8% in Scotland, 0.6% in Wales, and 1.1% in<br />
Northern Ireland;<br />
At UK level, the largest percentage increase was observed for professional, technical<br />
and social care staff, up 3.2% between 2009 and 2010. The largest decrease3 was<br />
observed for nursing and healthcare assistants and support staff, down 0.2%;<br />
Staff in England comprised 80% of the UK total; Scotland, 10%; Wales, 5%; and<br />
Northern Ireland, 4% 4 .<br />
Figure 2.2: <strong>NHS</strong> workforce by UK country, September 2006-2010<br />
1,200,000<br />
1,000,000<br />
800,000<br />
600,000<br />
400,000<br />
200,000<br />
0<br />
2006 2007 2008 2009 2010<br />
30 September each year<br />
England Scotland<br />
Wales Northern Ireland<br />
Sources: <strong>NHS</strong> Information Centre, ISD Scotland, StatsWales and DHSSPSNI.<br />
3 Except for ‘other’ staff, which represented just 3,700 (0.3%) of non-medical <strong>NHS</strong> staff in September 2010.<br />
4 Individual items do not sum to 100% because of rounding.