NHS pay review body: twenty-sixth report 2012 - Official Documents
NHS pay review body: twenty-sixth report 2012 - Official Documents
NHS pay review body: twenty-sixth report 2012 - Official Documents

Create successful ePaper yourself
Turn your PDF publications into a flip-book with our unique Google optimized e-Paper software.
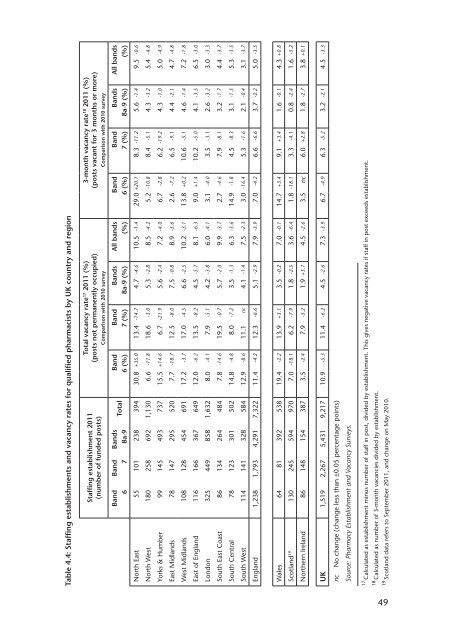
Table 4.4: Staffing establishments and vacancy rates for qualified pharmacists by UK country and region<br />
3-month vacancy rate18 2011 (%)<br />
(posts vacant for 3 months or more)<br />
Comparison with 2010 survey<br />
Total vacancy rate17 2011 (%)<br />
(posts not permanently occupied)<br />
Comparison with 2010 survey<br />
Staffing establishment 2011<br />
(number of funded posts)<br />
All bands<br />
(%)<br />
Bands<br />
8a-9 (%)<br />
Band<br />
7 (%)<br />
Band<br />
6 (%)<br />
All bands<br />
(%)<br />
Bands<br />
8a-9 (%)<br />
Band<br />
7 (%)<br />
Band<br />
6 (%)<br />
Total<br />
Bands<br />
8a-9<br />
Band<br />
7<br />
Band<br />
6<br />
North East 55 101 238 394 30.8 +35.0 13.4 -14.7 4.7 -4.6 10.5 -1.4 29.0 +20.1 8.3 -11.2 5.6 -1.4 9.5 -0.6<br />
North West 180 258 692 1,130 6.6 -11.8 18.6 -3.0 5.3 -2.8 8.5 -4.2 5.2 -10.8 8.4 -5.1 4.3 -3.2 5.4 -4.8<br />
Yorks & Humber 99 145 493 737 15.5 +14.6 6.7 -21.9 5.6 -2.4 7.2 -4.0 6.7 -2.8 6.2 -19.2 4.3 -1.0 5.0 -4.9<br />
East Midlands 78 147 295 520 7.7 -18.7 12.5 -8.0 7.5 -0.8 8.9 -5.6 2.6 -7.2 6.5 -9.1 4.4 -2.1 4.7 -4.8<br />
West Midlands 108 128 454 691 17.2 -3.7 17.0 -4.5 6.6 -2.5 10.2 -3.1 13.8 +0.2 10.6 -5.1 4.6 -1.4 7.2 -1.8<br />
East of England 116 166 367 649 12.0 -6.2 13.5 -8.2 4.5 -5.7 8.1 -6.3 9.0 +1.4 10.2 -5.0 4.1 -3.5 6.5 -3.0<br />
London 325 449 858 1,632 8.0 -4.1 7.9 -5.1 4.2 -3.8 6.0 -4.1 3.1 -4.0 3.5 -3.1 2.6 -3.2 3.0 -3.3<br />
South East Coast 86 134 264 484 7.8 -14.6 19.5 -0.7 5.7 -2.0 9.9 -3.7 2.7 -4.6 7.9 -8.1 3.2 -1.7 4.4 -3.7<br />
South Central 78 123 301 502 14.8 -4.8 8.0 -7.2 3.5 -1.3 6.3 -3.6 14.9 -1.8 4.5 -8.3 3.1 -1.5 5.3 -3.5<br />
South West 114 141 328 584 12.9 -8.6 11.1 nc 4.1 -1.4 7.5 -2.3 3.0 -16.4 5.3 -1.6 2.1 -0.4 3.1 -3.7<br />
England 1,238 1,793 4,291 7,322 11.4 -4.2 12.3 -6.6 5.1 -2.9 7.9 -3.9 7.0 -4.2 6.6 -6.6 3.7 -2.2 5.0 -3.5<br />
Wales 64 81 392 538 19.4 -2.2 13.9 +3.1 3.5 -0.2 7.0 -0.1 14.7 +3.4 9.1 +3.4 1.6 -0.1 4.3 +0.8<br />
Scotland 19 130 245 594 970 7.0 -18.1 6.2 -7.9 1.8 -2.5 3.6 -6.4 1.8 -18.1 3.3 -4.1 0.8 -2.4 1.6 -5.2<br />
Northern Ireland 86 148 154 387 3.5 -2.4 7.9 -5.2 1.9 +3.7 4.5 -2.6 3.5 nc 6.0 +2.8 1.8 -2.7 3.8 +0.1<br />
UK 1,519 2,267 5,431 9,217 10.9 -5.3 11.4 -6.2 4.5 -2.6 7.3 -3.9 6.7 -4.9 6.3 -5.2 3.2 -2.1 4.5 -3.3<br />
nc No change (change less than ±0.05 percentage points)<br />
Source: Pharmacy Establishment and Vacancy Surveys. 171819<br />
17 Calculated as establishment minus number of staff in post, divided by establishment. This gives negative vacancy rates if staff in post exceeds establishment.<br />
18 Calculated as number of 3-month vacancies divided by establishment.<br />
19 Scotland data refers to September 2011, and change on May 2010.<br />
49