NHS pay review body: twenty-sixth report 2012 - Official Documents
NHS pay review body: twenty-sixth report 2012 - Official Documents
NHS pay review body: twenty-sixth report 2012 - Official Documents

Create successful ePaper yourself
Turn your PDF publications into a flip-book with our unique Google optimized e-Paper software.
2.10<br />
12<br />
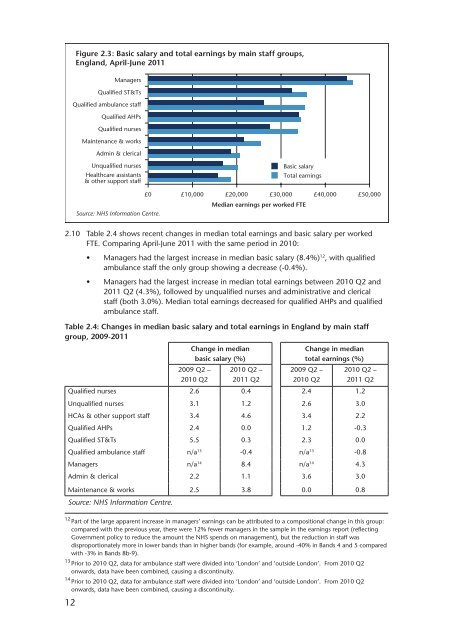
Figure 2.3: Basic salary and total earnings by main staff groups,<br />
England, April-June 2011<br />
Managers<br />
Qualified ST&Ts<br />
Qualified ambulance staff<br />
Qualified AHPs<br />
Qualified nurses<br />
Maintenance & works<br />
Admin & clerical<br />
Unqualified nurses<br />
Healthcare assistants<br />
& other support staff<br />
Source: <strong>NHS</strong> Information Centre.<br />
Basic salary<br />
Total earnings<br />
£0 £10,000 £20,000 £30,000 £40,000 £50,000<br />
Median earnings per worked FTE<br />
Table 2.4 shows recent changes in median total earnings and basic salary per worked<br />
FTE. Comparing April-June 2011 with the same period in 2010:<br />
•<br />
•<br />
12 Managers had the largest increase in median basic salary (8.4%) , with qualified<br />
ambulance staff the only group showing a decrease (-0.4%).<br />
Managers had the largest increase in median total earnings between 2010 Q2 and<br />
2011 Q2 (4.3%), followed by unqualified nurses and administrative and clerical<br />
staff (both 3.0%). Median total earnings decreased for qualified AHPs and qualified<br />
ambulance staff.<br />
Table 2.4: Changes in median basic salary and total earnings in England by main staff<br />
group, 2009-2011 1314<br />
Change in median<br />
basic salary (%)<br />
2009 Q2 –<br />
2010 Q2<br />
2010 Q2 –<br />
2011 Q2<br />
Change in median<br />
total earnings (%)<br />
2009 Q2 –<br />
2010 Q2<br />
2010 Q2 –<br />
2011 Q2<br />
Qualified nurses 2.6 0.4 2.4 1.2<br />
Unqualified nurses 3.1 1.2 2.6 3.0<br />
HCAs & other support staff 3.4 4.6 3.4 2.2<br />
Qualified AHPs 2.4 0.0 1.2 -0.3<br />
Qualified ST&Ts 5.5 0.3 2.3 0.0<br />
Qualified ambulance staff n/a 13 -0.4 n/a 13 -0.8<br />
Managers n/a 14 8.4 n/a 14 4.3<br />
Admin & clerical 2.2 1.1 3.6 3.0<br />
Maintenance & works 2.5 3.8 0.0 0.8<br />
Source: <strong>NHS</strong> Information Centre.<br />
12<br />
Part of the large apparent increase in managers’ earnings can be attributed to a compositional change in this group:<br />
compared with the previous year, there were 12% fewer managers in the sample in the earnings <strong>report</strong> (reflecting<br />
Government policy to reduce the amount the <strong>NHS</strong> spends on management), but the reduction in staff was<br />
disproportionately more in lower bands than in higher bands (for example, around -40% in Bands 4 and 5 compared<br />
with -3% in Bands 8b-9).<br />
13<br />
Prior to 2010 Q2, data for ambulance staff were divided into ‘London’ and ‘outside London’. From 2010 Q2<br />
onwards, data have been combined, causing a discontinuity.<br />
14<br />
Prior to 2010 Q2, data for ambulance staff were divided into ‘London’ and ‘outside London’. From 2010 Q2<br />
onwards, data have been combined, causing a discontinuity.