NHS pay review body: twenty-sixth report 2012 - Official Documents
NHS pay review body: twenty-sixth report 2012 - Official Documents
NHS pay review body: twenty-sixth report 2012 - Official Documents

You also want an ePaper? Increase the reach of your titles
YUMPU automatically turns print PDFs into web optimized ePapers that Google loves.
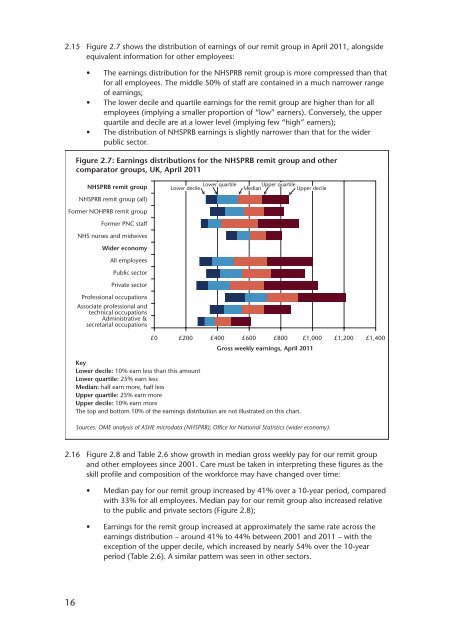
2.15<br />
16<br />
Figure 2.7 shows the distribution of earnings of our remit group in April 2011, alongside<br />
equivalent information for other employees:<br />
•<br />
•<br />
•<br />
The earnings distribution for the <strong>NHS</strong>PRB remit group is more compressed than that<br />
for all employees. The middle 50% of staff are contained in a much narrower range<br />
of earnings;<br />
The lower decile and quartile earnings for the remit group are higher than for all<br />
employees (implying a smaller proportion of “low” earners). Conversely, the upper<br />
quartile and decile are at a lower level (implying few “high” earners);<br />
The distribution of <strong>NHS</strong>PRB earnings is slightly narrower than that for the wider<br />
public sector.<br />
Figure 2.7: Earnings distributions for the <strong>NHS</strong>PRB remit group and other<br />
comparator groups, UK, April 2011<br />
<strong>NHS</strong>PRB remit group<br />
<strong>NHS</strong>PRB remit group (all)<br />
Former NOHPRB remit group<br />
Former PNC staff<br />
<strong>NHS</strong> nurses and midwives<br />
Wider economy<br />
All employees<br />
Public sector<br />
Private sector<br />
Professional occupations<br />
Associate professional and<br />
technical occupations<br />
Administrative &<br />
secretarial occupations<br />
Lower quartile Upper quartile<br />
Lower decile Median Upper decile<br />
£0 £200 £400 £600 £800 £1,000 £1,200 £1,400<br />
Gross weekly earnings, April 2011<br />
Key<br />
Lower decile: 10% earn less than this amount<br />
Lower quartile: 25% earn less<br />
Median: half earn more, half less<br />
Upper quartile: 25% earn more<br />
Upper decile: 10% earn more<br />
The top and bottom 10% of the earnings distribution are not illustrated on this chart.<br />
Sources: OME analysis of ASHE microdata (<strong>NHS</strong>PRB); Office for National Statistics (wider economy).<br />
2.16 Figure 2.8 and Table 2.6 show growth in median gross weekly <strong>pay</strong> for our remit group<br />
and other employees since 2001. Care must be taken in interpreting these figures as the<br />
skill profile and composition of the workforce may have changed over time:<br />
•<br />
•<br />
Median <strong>pay</strong> for our remit group increased by 41% over a 10-year period, compared<br />
with 33% for all employees. Median <strong>pay</strong> for our remit group also increased relative<br />
to the public and private sectors (Figure 2.8);<br />
Earnings for the remit group increased at approximately the same rate across the<br />
earnings distribution – around 41% to 44% between 2001 and 2011 – with the<br />
exception of the upper decile, which increased by nearly 54% over the 10-year<br />
period (Table 2.6). A similar pattern was seen in other sectors.