NHS pay review body: twenty-sixth report 2012 - Official Documents
NHS pay review body: twenty-sixth report 2012 - Official Documents
NHS pay review body: twenty-sixth report 2012 - Official Documents

Create successful ePaper yourself
Turn your PDF publications into a flip-book with our unique Google optimized e-Paper software.
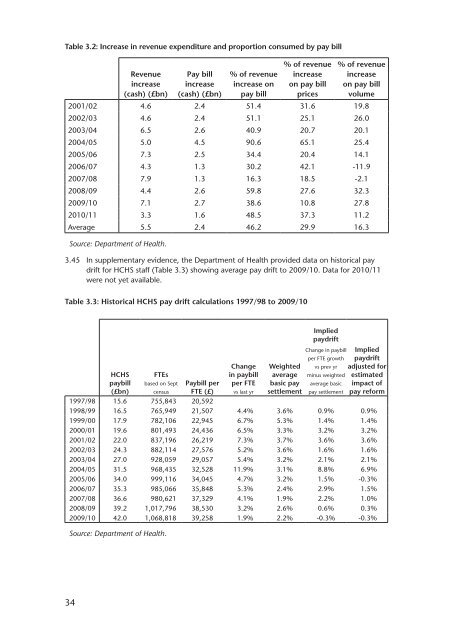
Table 3.2: Increase in revenue expenditure and proportion consumed by <strong>pay</strong> bill<br />
34<br />
Revenue<br />
increase<br />
(cash) (£bn)<br />
Pay bill<br />
increase<br />
(cash) (£bn)<br />
% of revenue<br />
increase on<br />
<strong>pay</strong> bill<br />
% of revenue<br />
increase<br />
on <strong>pay</strong> bill<br />
prices<br />
% of revenue<br />
increase<br />
on <strong>pay</strong> bill<br />
volume<br />
2001/02 4.6 2.4 51.4 31.6 19.8<br />
2002/03 4.6 2.4 51.1 25.1 26.0<br />
2003/04 6.5 2.6 40.9 20.7 20.1<br />
2004/05 5.0 4.5 90.6 65.1 25.4<br />
2005/06 7.3 2.5 34.4 20.4 14.1<br />
2006/07 4.3 1.3 30.2 42.1 -11.9<br />
2007/08 7.9 1.3 16.3 18.5 -2.1<br />
2008/09 4.4 2.6 59.8 27.6 32.3<br />
2009/10 7.1 2.7 38.6 10.8 27.8<br />
2010/11 3.3 1.6 48.5 37.3 11.2<br />
Average 5.5 2.4 46.2 29.9 16.3<br />
Source: Department of Health.<br />
3.45 In supplementary evidence, the Department of Health provided data on historical <strong>pay</strong><br />
drift for HCHS staff (Table 3.3) showing average <strong>pay</strong> drift to 2009/10. Data for 2010/11<br />
were not yet available.<br />
Table 3.3: Historical HCHS <strong>pay</strong> drift calculations 1997/98 to 2009/10<br />
HCHS<br />
<strong>pay</strong>bill<br />
(£bn)<br />
FTEs<br />
based on Sept<br />
census<br />
Paybill per<br />
FTE (£)<br />
Change<br />
in <strong>pay</strong>bill<br />
per FTE<br />
vs last yr<br />
Weighted<br />
average<br />
basic <strong>pay</strong><br />
settlement<br />
Implied<br />
<strong>pay</strong>drift<br />
Change in <strong>pay</strong>bill<br />
per FTE growth<br />
vs prev yr<br />
minus weighted<br />
average basic<br />
<strong>pay</strong> settlement<br />
Implied<br />
<strong>pay</strong>drift<br />
adjusted for<br />
estimated<br />
impact of<br />
<strong>pay</strong> reform<br />
1997/98 15.6 755,843 20,592<br />
1998/99 16.5 765,949 21,507 4.4% 3.6% 0.9% 0.9%<br />
1999/00 17.9 782,106 22,945 6.7% 5.3% 1.4% 1.4%<br />
2000/01 19.6 801,493 24,436 6.5% 3.3% 3.2% 3.2%<br />
2001/02 22.0 837,196 26,219 7.3% 3.7% 3.6% 3.6%<br />
2002/03 24.3 882,114 27,576 5.2% 3.6% 1.6% 1.6%<br />
2003/04 27.0 928,059 29,057 5.4% 3.2% 2.1% 2.1%<br />
2004/05 31.5 968,435 32,528 11.9% 3.1% 8.8% 6.9%<br />
2005/06 34.0 999,116 34,045 4.7% 3.2% 1.5% -0.3%<br />
2006/07 35.3 985,066 35,848 5.3% 2.4% 2.9% 1.5%<br />
2007/08 36.6 980,621 37,329 4.1% 1.9% 2.2% 1.0%<br />
2008/09 39.2 1,017,796 38,530 3.2% 2.6% 0.6% 0.3%<br />
2009/10 42.0 1,068,818 39,258 1.9% 2.2% -0.3% -0.3%<br />
Source: Department of Health.