NHS pay review body: twenty-sixth report 2012 - Official Documents
NHS pay review body: twenty-sixth report 2012 - Official Documents
NHS pay review body: twenty-sixth report 2012 - Official Documents

You also want an ePaper? Increase the reach of your titles
YUMPU automatically turns print PDFs into web optimized ePapers that Google loves.
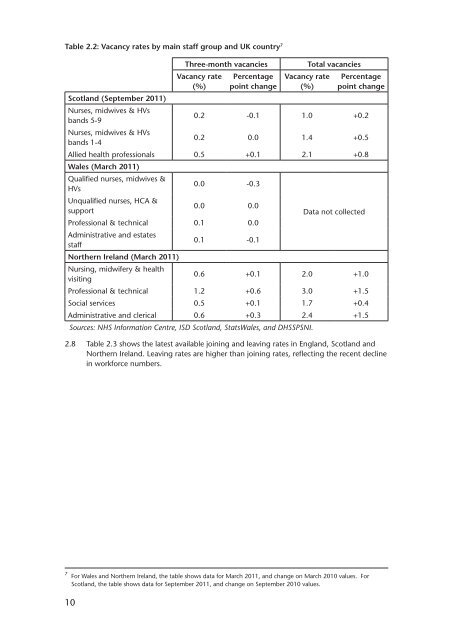
Table 2.2: Vacancy rates by main staff group and UK country 7<br />
Scotland (September 2011)<br />
Nurses, midwives & HVs<br />
bands 5-9<br />
Nurses, midwives & HVs<br />
bands 1-4<br />
10<br />
Three-month vacancies Total vacancies<br />
Vacancy rate<br />
(%)<br />
Percentage<br />
point change<br />
Vacancy rate<br />
(%)<br />
Percentage<br />
point change<br />
0.2 -0.1 1.0 +0.2<br />
0.2 0.0 1.4 +0.5<br />
Allied health professionals 0.5 +0.1 2.1 +0.8<br />
Wales (March 2011)<br />
Qualified nurses, midwives &<br />
HVs<br />
Unqualified nurses, HCA &<br />
support<br />
0.0 -0.3<br />
0.0 0.0<br />
Professional & technical 0.1 0.0<br />
Administrative and estates<br />
staff<br />
Northern Ireland (March 2011)<br />
Nursing, midwifery & health<br />
visiting<br />
0.1 -0.1<br />
Data not collected<br />
0.6 +0.1 2.0 +1.0<br />
Professional & technical 1.2 +0.6 3.0 +1.5<br />
Social services 0.5 +0.1 1.7 +0.4<br />
Administrative and clerical 0.6 +0.3 2.4 +1.5<br />
Sources: <strong>NHS</strong> Information Centre, ISD Scotland, StatsWales, and DHSSPSNI.<br />
2.8<br />
Table 2.3 shows the latest available joining and leaving rates in England, Scotland and<br />
Northern Ireland. Leaving rates are higher than joining rates, reflecting the recent decline<br />
in workforce numbers.<br />
7 For Wales and Northern Ireland, the table shows data for March 2011, and change on March 2010 values. For<br />
Scotland, the table shows data for September 2011, and change on September 2010 values.