Coming to Terms with Reality. Evaluation of the Belgian Debt Relief ...
Coming to Terms with Reality. Evaluation of the Belgian Debt Relief ...
Coming to Terms with Reality. Evaluation of the Belgian Debt Relief ...

Create successful ePaper yourself
Turn your PDF publications into a flip-book with our unique Google optimized e-Paper software.
| 200 |<br />
Annexes<br />
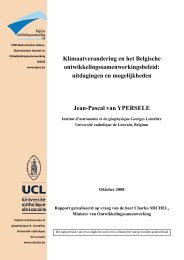
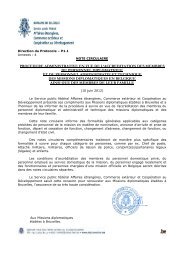
Secondly FURRER and KADDER (2007) show a stabilizing effect <strong>of</strong> debt relief on public<br />
expenditures on health between 2000 and 2005 and a contribution <strong>to</strong> <strong>the</strong> rise <strong>of</strong> public<br />
health expenditures in 2006 and 2007.<br />
Figure 22b Evolution <strong>of</strong> <strong>the</strong> Budget <strong>of</strong> <strong>the</strong> Ministry <strong>of</strong> Public Health (Millions <strong>of</strong> FCFA),<br />
decomposing <strong>Debt</strong> <strong>Relief</strong> and Normal Budget:<br />
120.000<br />
100.000<br />
80.000<br />
60.000<br />
40.000<br />
20.000<br />
0<br />
1998-1999<br />
1999-2000<br />
Source: FURRER and KADDER (2007)<br />
2000-2001<br />
2001-2002<br />
Total <strong>Debt</strong> <strong>Relief</strong> Used (HIPC, MDRI, C2D) Total expenses <strong>with</strong>out debt relief<br />
Thirdly IDA and <strong>the</strong> IMF (2007, table 3) have estimated that poverty-reducing<br />
expenditures have increased from 17% <strong>of</strong> government expenditures in 2000 <strong>to</strong> 33% in<br />
2006 and from 3.1% <strong>of</strong> GDP in <strong>the</strong> former year <strong>to</strong> 6.3% in <strong>the</strong> latter.<br />
We conclude that debt relief has contributed <strong>to</strong> a fiscal surplus. But its effect is overshadowed<br />
by that <strong>of</strong> <strong>the</strong> increasing oil price. On <strong>the</strong> o<strong>the</strong>r hand <strong>the</strong> share <strong>of</strong> expenditures on education,<br />
health and infrastructure in <strong>to</strong>tal public expenditures has risen substantially.<br />
5.6 Governance Indica<strong>to</strong>rs:<br />
In this subsection we analyse whe<strong>the</strong>r governance has improved between Decision and<br />
Completion. To do this we use a number <strong>of</strong> indica<strong>to</strong>rs. We start by analysing <strong>the</strong> sovereign<br />
ratings <strong>of</strong> Cameroon by rating agencies, before focusing on <strong>the</strong> Country Policy and<br />
Institutional Assessment (CPIA) Rating and <strong>the</strong> Kaufmann-Kraay-Mastruzzi (KKM)<br />
index. Finally we mention <strong>the</strong> Corruption Perception Index (CPI).<br />
The ratings by Standard & Poor’s and Fitch did not change much after Cameroon reached <strong>the</strong><br />
Decision Point. Standard &Poor’s gave both long and short term debt a B grade in 2003, and<br />
downgraded it in December 2004 <strong>to</strong> respectively CCC and C, because <strong>of</strong> public finance<br />
slippages. It <strong>the</strong>n upgraded those ratings twice (in May 2006 and February 2007), so that <strong>the</strong>y<br />
2003<br />
2004<br />
2005<br />
2006<br />
2007<br />
<strong>Coming</strong> <strong>to</strong> <strong>Terms</strong> <strong>with</strong> <strong>Reality</strong><br />
reached <strong>the</strong>ir 2003 levels. Fitch started <strong>with</strong> a B rating for both long and short term debt. In<br />
February 2005 it downgraded long term debt <strong>to</strong> B-, because <strong>of</strong> poor budgetary management. In<br />
June 2006 it upgraded it again <strong>to</strong> B.<br />
The Country Policy and Institutional Assessment (CPIA) Index is published every year by <strong>the</strong><br />
World Bank, and “rates countries against a set <strong>of</strong> 16 criteria grouped in four clusters: (a)<br />
economic management; (b) structural policies; (c) policies for social inclusion and equity; and (d)<br />
public sec<strong>to</strong>r management and institutions” (World Bank). The final mark for <strong>the</strong> country lies<br />
between 1, which means <strong>the</strong> rating is highly unsatisfac<strong>to</strong>ry for two years or more, and 6, which<br />
means it is good for two years or more. Cameroon’s score decreased from 3.3 in 2005 <strong>to</strong> 3.2 in<br />
2006, which puts <strong>the</strong> country in <strong>the</strong> group <strong>of</strong> “weak performers”. This is mainly due <strong>to</strong> <strong>the</strong> weak<br />
business regula<strong>to</strong>ry environment, <strong>the</strong> policies and institutions aimed at environmental sustainability<br />
and <strong>the</strong> inefficiency <strong>of</strong> revenue mobilisation. The country kept <strong>the</strong> same rating IN 2007.<br />
D. Kaufmann, A. Kraay, and M. Mastruzzi (2008) constructed an indica<strong>to</strong>r <strong>of</strong> <strong>the</strong> quality <strong>of</strong><br />
governance in a country, <strong>the</strong> so-called KKM Index. This index is based on six governance<br />
indica<strong>to</strong>rs (on a scale from -2,5 <strong>to</strong> 2,5), divided in<strong>to</strong> three groups. This is one <strong>of</strong> <strong>the</strong> few<br />
governance index that covers a period <strong>of</strong> more than ten years (1996-2007).<br />
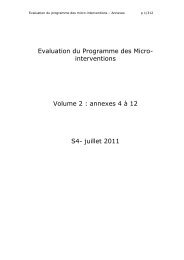
The first group covers “<strong>the</strong> process by which governments are selected, moni<strong>to</strong>red and replaced”,<br />
and is composed <strong>of</strong> two indica<strong>to</strong>rs: “voice and accountability” and “political stability and absence <strong>of</strong><br />
violence”. The former includes measures <strong>of</strong> <strong>the</strong> political process, <strong>the</strong> respect <strong>of</strong> civil liberties and <strong>the</strong><br />
political rights. The latter integrates <strong>the</strong> perception or likelihood that <strong>the</strong> government will be<br />
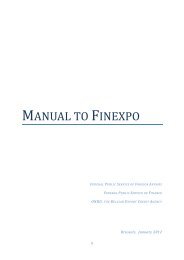
overthrown, and <strong>the</strong> perception <strong>of</strong> internal violence. We represent both in figure 23. We observe that<br />
<strong>the</strong>re is no particular improvement in <strong>the</strong> “voice and accountability”, but <strong>the</strong> political stability<br />
indica<strong>to</strong>r has increased between 1996 and 2000 and between 2004 and 2006.<br />
Figure 23 “Voice and Accountability” and “Political Stability and Absence <strong>of</strong> Violence”<br />
Indica<strong>to</strong>rs, 1996 - 2007<br />
Score (-2,5; 2,5)<br />
0,0<br />
-0,2<br />
-0,4<br />
-0,6<br />
-0,8<br />
-1,0<br />
-1,2<br />
-1,4<br />
-1,6<br />
1996<br />
1998<br />
2000<br />
Political stability<br />
voice and accountability<br />
2002<br />
2003<br />
Source: Kaufmann D., A. Kraay, and M. Mastruzzi (2008)<br />
2004<br />
2005<br />
2006<br />
2007<br />
| 201 |