Coming to Terms with Reality. Evaluation of the Belgian Debt Relief ...
Coming to Terms with Reality. Evaluation of the Belgian Debt Relief ...
Coming to Terms with Reality. Evaluation of the Belgian Debt Relief ...

You also want an ePaper? Increase the reach of your titles
YUMPU automatically turns print PDFs into web optimized ePapers that Google loves.
| 206 |<br />
Annexes<br />
6 Impact on Economic Growth and Poverty<br />
In this section we analyze <strong>the</strong> effects <strong>of</strong> debt relief obtained by Cameroon on two basic<br />
measures <strong>of</strong> wellbeing, i.e. economic growth and <strong>the</strong> evolution <strong>of</strong> poverty. From <strong>the</strong> outset<br />
we should emphasize that it is not evident <strong>to</strong> make definitive statements on <strong>the</strong> issue. First<br />
it is <strong>to</strong>o early <strong>to</strong> observe <strong>the</strong> impact <strong>of</strong> debt forgiveness: <strong>the</strong> bulk <strong>of</strong> <strong>the</strong> debt cancellation<br />
was realized when Cameroon reached its Completion Point in 2006, and its effects may be<br />
spread over several years. Our most recent data are for 2007. Second <strong>the</strong> data on growth<br />
and poverty we observe are <strong>the</strong> result <strong>of</strong> a number <strong>of</strong> variables, debt forgiveness being one<br />
<strong>of</strong> <strong>the</strong>m. So it is difficult, if not impossible, <strong>to</strong> single out <strong>the</strong> effect <strong>of</strong> one individual<br />
variable. Therefore we analyze whe<strong>the</strong>r <strong>the</strong> data on growth and poverty we observe<br />
between 2000 and 2006 or 2007 are compatible <strong>with</strong> a positive impact <strong>of</strong> <strong>the</strong> debt<br />
forgiveness that occurred over this period and <strong>of</strong> <strong>the</strong> expectation in <strong>the</strong> years prior <strong>to</strong> 2006<br />
<strong>of</strong> a wider debt relief when <strong>the</strong> country would reach its Completion Point.<br />
Before starting our analysis, it is worthwhile <strong>to</strong> mention that <strong>the</strong> Interim PRSP, published<br />
in August 2000 and whose final version was accepted by <strong>the</strong> IMF in 2003, defined <strong>the</strong><br />
major challenges for <strong>the</strong> country as <strong>the</strong> need <strong>to</strong> “diversify its economy, consolidate growth,<br />
and improve <strong>the</strong> standard <strong>of</strong> living <strong>of</strong> its population”. The document did specify <strong>the</strong><br />
weaknesses <strong>of</strong> <strong>the</strong> educational system (a relatively low access and completion rate for <strong>the</strong><br />
primary education, coupled <strong>with</strong> a low transition rate between primary and secondary<br />
education) and <strong>the</strong> deterioration <strong>of</strong> health conditions (increasing child mortality, <strong>the</strong><br />
persistence <strong>of</strong> malaria, meningitis and viral hepatitis, and <strong>the</strong> alarming climb in <strong>the</strong> rate <strong>of</strong><br />
HIV/AIDS infection). But apart from mentioning <strong>the</strong> Millennium Development Goals, <strong>the</strong><br />
Interim PRSP did not set any specific short term objectives.<br />
6.1 Impact on economic growth<br />
We first compare data on economic growth over <strong>the</strong> period 2000-2006 <strong>with</strong> those <strong>of</strong> <strong>the</strong><br />
preceding six years. The former period covers more or less <strong>the</strong> Interim Period between<br />
Cameroon’s Decision and Completion Point, and <strong>the</strong> latter starts after <strong>the</strong> devaluation <strong>of</strong><br />
<strong>the</strong> CFA franc in January 1994. The first row <strong>of</strong> table 7 shows quite clearly that over <strong>the</strong><br />
period 2000-2006 <strong>the</strong> growth performance <strong>of</strong> Cameroon has deteriorated compared <strong>to</strong> <strong>the</strong><br />
previous six years. In each <strong>of</strong> <strong>the</strong> years 2001-2003 Cameroon’s growth rate <strong>of</strong> GDP was<br />
4% or higher, in line <strong>with</strong> <strong>the</strong> previous six years. But from 2004 onwards <strong>the</strong> GDP growth<br />
rate was lower than 4% <strong>with</strong> a particularly poor performance in 2005 (2.3%). In 2007, in<br />
line <strong>with</strong> <strong>the</strong> previous three years, <strong>the</strong> growth rate was 3.4%. Remark that <strong>the</strong> international<br />
economic climate over <strong>the</strong> period under consideration, especially in <strong>the</strong> years after 2003,<br />
was quite favorable for Cameroon, <strong>with</strong> <strong>the</strong> increase <strong>of</strong> <strong>the</strong> oil price and favorable prices <strong>of</strong><br />
primary commodities.<br />
Table 7 also shows that Cameroon’s growth performance was weak relative <strong>to</strong> that <strong>of</strong><br />
comparable groups <strong>of</strong> countries, such as Sub Saharan Africa and <strong>the</strong> low and lower middle<br />
income countries. Over <strong>the</strong> years 1994-2000 Cameroon outperformed <strong>the</strong>se three groups <strong>of</strong><br />
<strong>Coming</strong> <strong>to</strong> <strong>Terms</strong> <strong>with</strong> <strong>Reality</strong><br />
countries (if we exclude fast growing India and China from respectively <strong>the</strong> low and <strong>the</strong><br />
lower middle income groups), but between 2000 and 2006 Cameroon’s growth rate was a<br />
full 1% lower than <strong>the</strong> average <strong>of</strong> Sub Saharan Africa and <strong>of</strong> <strong>the</strong> lower middle income<br />
countries (excluding China) and more than 1.5% below that <strong>of</strong> <strong>the</strong> low income countries<br />
(excluding India).<br />
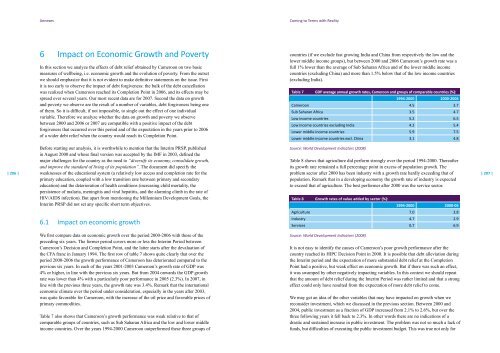
Table 7 GDP average annual growth rates, Cameroon and groups <strong>of</strong> comparable countries (%):<br />
1994-2000 2000-2006<br />
Cameroon 4.5 3.7<br />
Sub Saharan Africa 3.5 4.7<br />
Low income countries 5.2 6.5<br />
Low income countries excluding India 4.2 5.4<br />
Lower middle income countries 5.9 7.5<br />
Lower middle income countries excl. China 3.1 4.8<br />
Source: World Development Indica<strong>to</strong>rs (2008)<br />
Table 8 shows that agriculture did perform strongly over <strong>the</strong> period 1994-2000. Thereafter<br />
its growth rate remained a full percentage point in excess <strong>of</strong> population growth. The<br />
problem sec<strong>to</strong>r after 2000 has been industry <strong>with</strong> a growth rate hardly exceeding that <strong>of</strong><br />
population. Remark that in a developing economy <strong>the</strong> growth rate <strong>of</strong> industry is expected<br />
<strong>to</strong> exceed that <strong>of</strong> agriculture. The best performer after 2000 was <strong>the</strong> service sec<strong>to</strong>r.<br />
Table 8 Growth rates <strong>of</strong> value added by sec<strong>to</strong>r (%):<br />
1994-2000 2000-06<br />
Agriculture 7.0 3.8<br />
Industry 4.7 2.9<br />
Services 0.7 6.9<br />
Source: World Development Indica<strong>to</strong>rs (2008)<br />
It is not easy <strong>to</strong> identify <strong>the</strong> causes <strong>of</strong> Cameroon’s poor growth performance after <strong>the</strong><br />
country reached its HIPC Decision Point in 2000. It is possible that debt alleviation during<br />
<strong>the</strong> Interim period and <strong>the</strong> expectation <strong>of</strong> more substantial debt relief at <strong>the</strong> Completion<br />
Point had a positive, but weak effect on economic growth. But if <strong>the</strong>re was such an effect,<br />
it was swamped by o<strong>the</strong>r negatively impacting variables. In this context we should repeat<br />
that <strong>the</strong> amount <strong>of</strong> debt relief during <strong>the</strong> Interim Period was ra<strong>the</strong>r limited and that a strong<br />
effect could only have resulted from <strong>the</strong> expectation <strong>of</strong> more debt relief <strong>to</strong> come.<br />
We may get an idea <strong>of</strong> <strong>the</strong> o<strong>the</strong>r variables that may have impacted on growth when we<br />
reconsider investment, which we discussed in <strong>the</strong> previous section. Between 2000 and<br />
2004, public investment as a fraction <strong>of</strong> GDP increased from 2.1% <strong>to</strong> 2.6%, but over <strong>the</strong><br />
three following years it fell back <strong>to</strong> 2.3%. In o<strong>the</strong>r words <strong>the</strong>re are no indications <strong>of</strong> a<br />
drastic and sustained increase in public investment. The problem was not so much a lack <strong>of</strong><br />
funds, but difficulties <strong>of</strong> executing <strong>the</strong> public investment budget. This was true not only for<br />
| 207 |